Download
1 / 55
600 likes | 870 Views
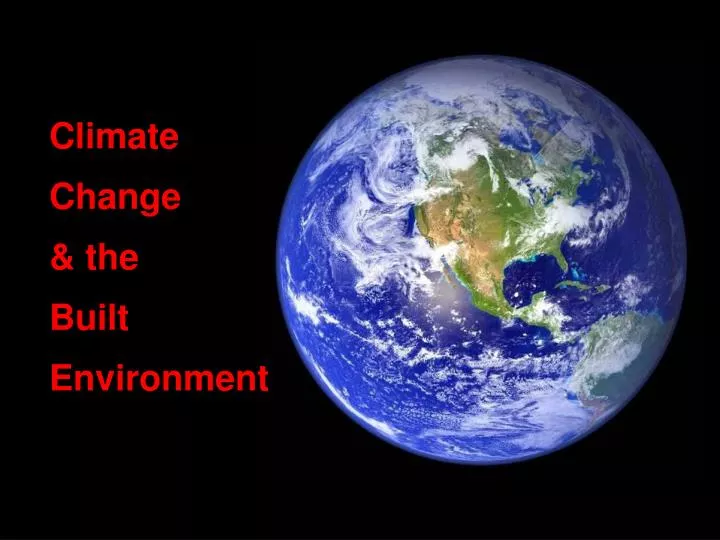
Climate Change & the Built Environment. DALLAS. SHANGHAI. GUJARAT. DUBAI. 72 billion people . Earth’s Surface Temperature. We are at 385 ppm. +10.5°F 6 ° C. We will reach 450 ppm in 2035. Increasing at + 2.5 ppm annually. +2.7°F 1.8 ° C.

E N D
72 billion people
Earth’s Surface Temperature We are at 385 ppm +10.5°F 6°C We will reach 450 ppm in 2035 Increasing at +2.5 ppm annually +2.7°F 1.8°C At 450 ppm CO2 “we will trigger potentially irreversible glacial melt & sea level rise out of humanity’s control” Source: UN Intergovernmental Panel on Climate Change (IPCC)
As CO2 increases… CO2 Emissions CO2 Concentration (Billion tons per year) (ppm in atmosphere) Carbon Dioxide Emissions Carbon Dioxide Concentrations Source: UN Intergovernmental Panel on Climate Change (IPCC)
Temperature & sea-level rise… Greenland 5m Temperature Change CO Sea Level Rise meters (m) Source: UN Intergovernmental Panel on Climate Change (IPCC)
USA Energy Demand & Coal +237 CFPPs Quadrillion Btu (QBtu) 704 CFPPs now +34% 34 QBtu Sources: Architecture 2030, U.S. Energy Information Agency & CalStar analysis
750,000 Toyota Prius driverssave 2.35M MT of CO2 per year 1 CFPP in 1 year Sources: U.S. EPA, Toyota, CalStar analysis
Wal-Mart investing $500M in 7 years to reduce energy & CO2 by 20% 1 CFPP in 1 month Source: Architecture 2030
Home Depot planting 300,000 trees to absorb CO2… 1 CFPP in 10 days Source: Architecture 2030
Worldwide Energy Demand & Coal +2320 CFPPs Quadrillion Btu (QBtu) 3682 CFPPs now +62% 276 QBtu Sources: Architecture 2030, U.S. Energy Information Agency & CalStar analysis
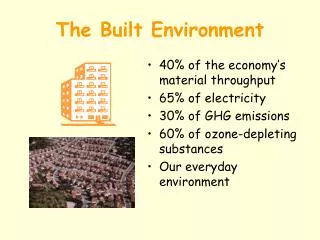
USA Built Environment 51% total energy 55% total CO2 Source: “Potential Carbon Emissions Reductions In the Building Sector by 2030”, Brown, Stovall & Hughes, Oak Ridge National Lab
USA Energy Demand 51% 27% 22% Built Environment Transport Industry Source: EIA, CalStar analysis
USA Energy Built Environment 51% Residential 22% Commercial 17% Operations 39% Buildings 9% Infra 3% Materials 12% Source: EIA, CalStar analysis
The Problem Food & Water 19% Light 18% Heat & Cool 38% Other 12% Appliances 13%
Half of USA Electricity from Coal Building Operations 76% of USA electricity Industrial 23% Transportation 1% Source: Freedonia Group, “World Cement to 2010” (2006)
Demolish 50Bn sf Remodel 150Bn sf U.S. Building Inventory USA Construction Cash Flood: 2035 Build new 150Bn sf 2035 400Bn sf 75% touched $30T new construction + $10T renovate 2008 305Bn sf
BUILD STRONG BUILD GREEN
CHINA Built Environment 37% total energy 52% total CO2 Source: “Potential Carbon Emissions Reductions In the Building Sector by 2030”, Brown, Stovall & Hughes, Oak Ridge National Lab
China Energy Demand 37% 50% 9% 6% Built Environment Industry Transport Agr Source: LBNL
China Energy & Built Environment Built Environment 37% Residential 14% Commercial 9% Operations 23% Buildings 11% Infra 3% Materials 14% Source: EIA, CalStar analysis
Energy Deficit BAU Scenario to 2050 Million Metric Ton Coal Equivalent Demand BAU energy demand Coal DEFICIT Oil Natural Gas Hydro Nuclear 2030 peak Wind COAL Solar, geothermal Source: Lawrence Berkeley National Lab, 2050China Energy Study, preliminary estimates
China Built Environment Business As Usual (BAU) Million Metric Ton Coal Equivalent Materialscement steel glass bricks wood Building materials Operations cooling heating lighting appliances Building operations Source: Lawrence Berkeley National Lab, 2050China Energy Study, preliminary estimates
China Built Environment Net Zero Energy (NZE) Million Metric Ton Coal Equivalent Materialscement steel glass bricks wood SAVINGS Building materials Operations cooling heating lighting appliances Building operations Source: Lawrence Berkeley National Lab, 2050China Energy Study, preliminary estimates
Net Zero Buildings 2030 deficit reduction by >33% Million Metric Ton Coal Equivalent DEFICIT BAU energy demand NZE SAVINGS All other 2030 peak COAL Source: Lawrence Berkeley National Lab, 2050China Energy Study, preliminary estimates
China Construction 99B m2 $10T new construction + $1T renovate 80% built since 2005 2005 to 2040 1940 to 2005
BUILD STRONG BUILD GREEN 70 years 50 years Pearl River Building, Guangdong Adrian Smith + Gordon Gill Architecture Agro-housing project , Wuhan Knafo Klimor Architects
Harmonious Society Danger path Green path
Eliminate 27B tons of CO2 Sources: Vattenfall, McKinsey & Co.
4B tons of CO2, negative cost Cum Gt CO2 eliminated 50 €/t CO2 0.50 1.0 1.5 2.0 2.5 3.0 3.5 4.0 0 -50 Fridges / freezers Retrofit facade -100 Appliances Lighting A/C -150 Water heating Retrofit floor/roof Building envelope Heaters -200 Washers/ dryers Retrofit floor/ roof Windows Other appliances New-build insulation …all green building materials & technologies Sources: Vattenfall, McKinsey & Co.
Same/better cost Same/better performance Superior sustainability Scalable globally
R-15 Windows Save 38% of building energy bill 3 year payback
Cement Portland cement, 8% of CO2 2.5 billion tons/year $150B world market Industry stuck Same since 1824
Automobiles ~ CementBillion Tons CO2 2.8 BT 700M autos x 4T 2.4 BT 2.6BT cement x 0.9 ~
CHINA 51% of world Cement 1.36 billion Tonnes in 2007
CalStar 8/8/2014 CalStar Cement - Confidential – Do Not Distribute 46
Lowest Levelized Cost of Energy ($/kWh)
Electric Buildings 100 watts per m2 North, South East, West 3 year payback
ZETA Communities Zero Energy Technology & Architecture