Download
1 / 40
410 likes | 439 Views
Learn about correlation analysis, types of correlations, factors affecting them, significance testing, scatterplots, and correlation coefficients. Explore examples such as smoking and blood pressure correlation. Understand how to measure and interpret correlations effectively.

E N D
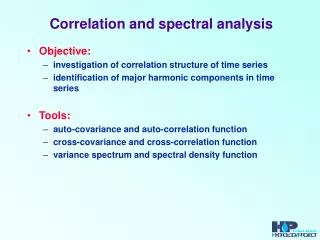
Major Points - Correlation • Questions answered by correlation • Scatterplots • An example • The correlation coefficient • Other kinds of correlations • Factors affecting correlations • Testing for significance
The Question • Are two variables related? • Does one increase as the other increases? • e. g. skills and income • Does one decrease as the other increases? • e. g. health problems and nutrition • How can we get a numerical measure of the degree of relationship?
Scatterplots • AKA scatter diagram or scattergram. • Graphically depicts the relationship between two variables in two dimensional space.
An Example • Does smoking cigarettes increase systolic blood pressure? • Plotting number of cigarettes smoked per day against systolic blood pressure • Fairly moderate relationship • Relationship is positive
Smoking and BP • Note relationship is moderate, but real. • Why do we care about relationship? • What would conclude if there were no relationship? • What if the relationship were near perfect? • What if the relationship were negative?
Heart Disease and Cigarettes • Data on heart disease and cigarette smoking in 21 developed countries (Landwehr and Watkins, 1987) • Data have been rounded for computational convenience. • The results were not affected.
The Data Surprisingly, the U.S. is the first country on the list--the country with the highest consumption and highest mortality.
Scatterplot of Heart Disease • CHD Mortality goes on ordinate (Y axis) • Why? • Cigarette consumption on abscissa (X axis) • Why? • What does each dot represent? • Best fitting line included for clarity
What Does the Scatterplot Show? • As smoking increases, so does coronary heart disease mortality. • Relationship looks strong • Not all data points on line. • This gives us “residuals” or “errors of prediction” • To be discussed later
Correlation • Co-relation • The relationship between two variables • Measured with a correlation coefficient • Most popularly seen correlation coefficient: Pearson Product-Moment Correlation
Types of Correlation • Positive correlation • High values of X tend to be associated with high values of Y. • As X increases, Y increases • Negative correlation • High values of X tend to be associated with low values of Y. • As X increases, Y decreases • No correlation • No consistent tendency for values on Y to increase or decrease as X increases
Correlation Coefficient • A measure of degree of relationship. • Between 1 and -1 • Sign refers to direction. • Based on covariance • Measure of degree to which large scores on X go with large scores on Y, and small scores on X go with small scores on Y • Think of it as variance, but with 2 variables instead of 1 (What does that mean??)
Covariance • Remember that variance is: • The formula for co-variance is: • How this works, and why? • When would covXY be large and positive? Large and negative?
What the heck is a covariance? I thought we were talking about correlation? Example
Correlation Coefficient • Pearson’s Product Moment Correlation • Symbolized by r • Covariance ÷ (product of the 2 SDs) • Correlation is a standardized covariance
Calculation for Example • CovXY = 11.12 • sX = 2.33 • sY = 6.69
Example • Correlation = .713 • Sign is positive • Why? • If sign were negative • What would it mean? • Would not alter the degree of relationship.
Other calculations • Z-score method • Computational (Raw Score) Method
Other Kinds of Correlation • Spearman Rank-Order Correlation Coefficient (rsp) • used with 2 ranked/ordinal variables • uses the same Pearson formula
Other Kinds of Correlation • Point biserial correlation coefficient (rpb) • used with one continuous scale and one nominal or ordinal or dichotomous scale. • uses the same Pearson formula
Other Kinds of Correlation • Phi coefficient () • used with two dichotomous scales. • uses the same Pearson formula
Factors Affecting r • Range restrictions • Looking at only a small portion of the total scatter plot (looking at a smaller portion of the scores’ variability) decreases r. • Reducing variability reduces r • Nonlinearity • The Pearson r (and its relatives) measure the degree of linear relationship between two variables • If a strong non-linear relationship exists, r will provide a low, or at least inaccurate measure of the true relationship.
Factors Affecting r • Heterogeneous subsamples • Everyday examples (e.g. height and weight using both men and women) • Outliers • Overestimate Correlation • Underestimate Correlation
Countries With Low Consumptions Data With Restricted Range Truncated at 5 Cigarettes Per Day 20 18 16 14 12 CHD Mortality per 10,000 10 8 6 4 2 2.5 3.0 3.5 4.0 4.5 5.0 5.5 Cigarette Consumption per Adult per Day
Testing Correlations • So you have a correlation. Now what? • In terms of magnitude, how big is big? • Small correlations in large samples are “big.” • Large correlations in small samples aren’t always “big.” • Depends upon the magnitude of the correlation coefficient AND • The size of your sample.
Testing r • Population parameter = • Null hypothesis H0: = 0 • Test of linear independence • What would a true null mean here? • What would a false null mean here? • Alternative hypothesis (H1) 0 • Two-tailed
Tables of Significance • We can convert r to t and test for significance: • Where DF = N-2
Tables of Significance • In our example r was .71 • N-2 = 21 – 2 = 19 • T-crit (19) = 2.09 • Since 6.90 is larger than 2.09 reject r = 0.
Computer Printout • Printout gives test of significance.