How to Interpret Regression Analysis Results: P-values & Coefficients?
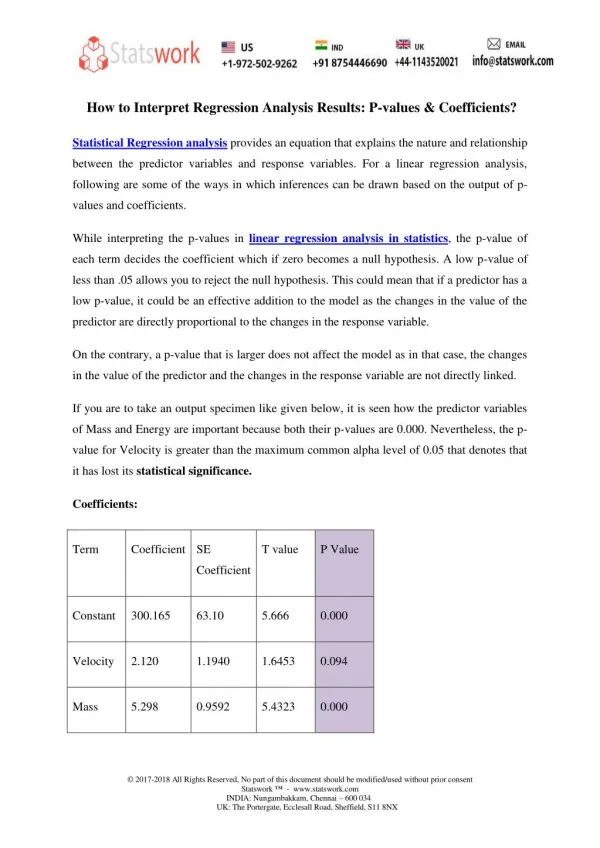
Statistical Regression analysis provides an equation that explains the nature and relationship between the predictor variables and response variables. For a linear regression analysis, following are some of the ways in which inferences can be drawn based on the output of p-values and coefficients. While interpreting the p-values in linear regression analysis in statistics, the p-value of each term decides the coefficient which if zero becomes a null hypothesis. A low p-value of less than .05 allows you to reject the null hypothesis. This could mean that if a predictor has a low p-value, it could be an effective addition to the model as the changes in the value of the predictor are directly proportional to the changes in the response variable. While interpreting regression analysis, the main effect of the linear term is not solely enough. Fitted line plots are necessary to detect statistical significance of correlation coefficients and p-values. They should be coupled with a deeper knowledge of statistical regression analysis in detail when it is multiple regression that is dealt with, also taking into account residual plots generated. Contact Us: UK NO: 44-1143520021 India No: 91-8754446690 US NO: 1-972-502-9262 Email: info@statswork.com Website: http://www.statswork.com/ Landline: 91-44-42124284
★
★
★
★
★
88 views • 3 slides
