Download
1 / 32
340 likes | 654 Views
Genome analysis. Genome – the sum of genes and intergenic sequences of a haploid cell. The value of genome sequences lies in their annotation. Annotation – Characterizing genomic features using computational and experimental methods Genes: Four levels of annotation

E N D
Genome analysis. Genome – the sum of genes and intergenic sequences of a haploid cell.
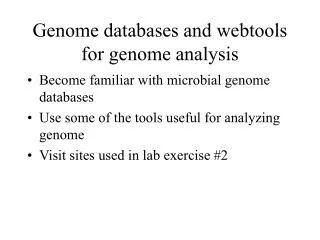
The value of genome sequences lies in their annotation • Annotation – Characterizing genomic features using computational and experimental methods • Genes: Four levels of annotation • Gene Prediction – Where are genes? • What do they look like? • What do they encode? • What proteins/pathways involved in?
Accuracy of genome annotation. • In most genomes functional predictions has been made for majority of genes 54-79%. • The source of errors in annotation: - overprediction (those hits which are statistically significant in the database search are not checked) - multidomain protein (found the similarity to only one domain, although the annotation is extended to the whole protein). The error of the genome annotation can be as big as 25%.
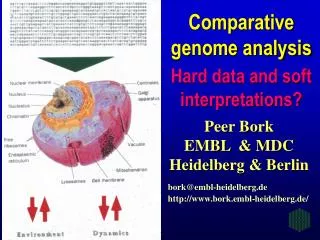
Comparative genomics - comparison of gene number, gene content and gene location in genomes.. Campbell & Heyer “Genomics”
Analysis of gene order (synteny). Genes with a related function are frequently clustered on the chromosome. Ex: E.coli genes responsible for synthesis of Trp are clustered and order is conserved between different bacterial species. Operon: set of genes transcribed simultaneously with the same direction of transcription
Analysis of gene order (synteny). Koonin & Galperin “Sequence, Evolution, Function”
Analysis of gene order (synteny). • The order of genes is not very well conserved if %identity between prokaryotic genomes is less than 50% • The gene neighborhood can be conserved so that all neighboring genes belong to the same functional class. • Functional prediction can be based on gene neighboring.
Role of “junk” DNA in a cell. • There is almost no correlation between the number of genes and organism’s complexity. • There is a correlation between the amount of nonprotein-coding DNA and complexity.
New interpretation of introns. • Modern introns envaded eukaryotes late in evolution, they are derived from self-splicing mobile genetic elements similar to group II introns. • Nucleus which separates transcription and translation, appears only in eukaryotes. For prokaryotes there would not be time for introns to splice themselves out. • Hypothesis: important regulatory role of introns.
Regulatory role of non-coding regions. • “Micro-RNAs” control timing of processes in development and apoptosis. • Intron’s RNAs inform about the transcription of a particular gene. • Alternative splicing can be regulated by non-coding regions. • Non-coding regions can be very well conserved between the species and many genetic deseases have been linked to variations/mutations in non-coding regions.
COGs – Clusters of Orthologous Genes. Orthologs – genes in different species that evolved from a common ancestral gene by speciation; Paralogs – paralogs are genes related by duplication within a genome.
Classwork I: Comparing microbial genomes. • Go to http://www.ncbi.nlm.nih.gov/genomes/lproks.cgi • Select Thermus thermophilus genome • View TaxTable • What gene clusters do you see which are common with Archaea?
Systems biology. • Integrative approach to study the relationships and interactions between various parts of a complex system. Goal: to develop a model of interacting components for the whole system.
Basic notions of networks. Network (graph) – a set of vertices connected via edges. The degree of a vertex – the total number of connections of a vertex. Random networks – networks with a disordered arrangement of edges.
Properties of networks. • Vertex degree distribution/connectivity. • Clustering coefficient. • Network diameter.
Characteristics of networks: vertex degree distribution. K=2 K=2 K=3 K=1 P(k,N) – degree distribution, k - degree of the vertex, N - number of vertices. If vertices are statistically independent and connections are random, the degree distribution completely determines the statistical properties of a network.
Characteristics of networks: clustering coefficient. The clustering coefficient characterizes the density of connections in the environment close to a given vertex. d – total number of edges connecting nearest neighbors; n – number of nearest verteces for a given vertex C = 2/6
Characteristics of networks: diameter, small-world. Diameter of a network – shortest path along the existing links averaged over all pairs of verteces. Distance between two verteces = the smallest number of steps one can take to reach on vertex from another. Small-world character of the networks: any two verteces can be connected by relatively short paths. For random networks the diameter increases logarithmically with the addition of new verteces.
Different network models:Erdos-Renyi model. • Start with the fixed set of vertices. • Iterate the following process: Chose randomly two vertices and connect them by an edge. • Stop at certain number of edges. ln(P(k)) Degree distribution – Poisson distribution, λ – average degree ln( k )
Different network models: model 2. • At each step, a new vertex is added to the graph • Simultaneously, a pair of randomly chosen vertices is connected by an edge. This is a non-equilibrium model – the total number of vertices is not fixed. ln(P(k)) Degree distribution – exponential distribution. ln(k)
Different network models: Barabasi-Alberts. Model of preferential attachment. • At each step, a new vertex is added to the graph • The new vertex is attached to one of old vertices with probability proportional to the degree of that old vertex. ln(P(k)) Degree distribution – power law distribution. ln(k)
Power Law distribution Multiplying k by a constant, does not change the shape of the distribution – scale free distribution. From T. Przytycka
Difference between scale-free and random networks. Random networks are homogeneous, most nodes have the same number of links. Scale-free networks have a few highly connected verteces.
ATP ATP ADP ADP D-Glucose 2.7.1.1 Hexokinase Pentose phosphate cycle D-Glucose-6P 5.3.1.9 Phosphoglucose isomerase D-Fructose-6P 2.7.1.11 Phosphofructokinase D-Fructose-1,6P2 4.1.2.13 Aldolase 5.3.1.1 Triose phosphate isomerase Glycerone-P Glyceraldehyde-3P NAD+ + Pi 1.2.1.12 Glyceraldehyde 3-P dehydrogenase NADH + H+ Glycerate-1,3P2 Glycerolipid metabolism ADP 2.7.2.3 Phoshoglycerate kinase ATP Apicoplast FA synthesis Glycerate-3P 5.4.2.1 Phosphoglycerate mutase Glycerate-2P 4.2.1.11 Enolase H2O Phosphoenol-pyruvate ADP Pyruvate metabolism 2.7.1.40 Pyruvate kinase ATP Pyruvate NADH + H+ 1.1.1.27 Lactate dehydrogenase NAD+ Lactate Example 1: the large-scale organization of metabolic networks. Glycolysis metabolic network enzymes subsbstrate Slide credit: Hagai Ginsburg
Example 1: the large-scale organization of metabolic networks. Jeong et al, Nature, 2000: • Compared metabolic networks of 43 organisms. • Verteces – substrates connected with each other through links/metabolic reactions. Results: - Scale-free nature of metabolic networks for all organisms, γ = 2.2 - Diameters of metabolic networks for all organisms are the same.
Biological interpretations of power-law connectivity. • Few verteces dominate the overall connectivity of network. • Self-similarity of networks. • Small diameter, respond quickly to a mutation which can destroy an enzyme, activate different paths quickly.
Protein-protein interaction networks. Sneppen & Maslov: • Verteces – proteins, edges connect those proteins which interact in a cell • Network: 3278 interactions,1289 proteins • Scale free network, g = 2.5 +/- 0.3 Sneppen & Maslov