Download
1 / 1

E N D
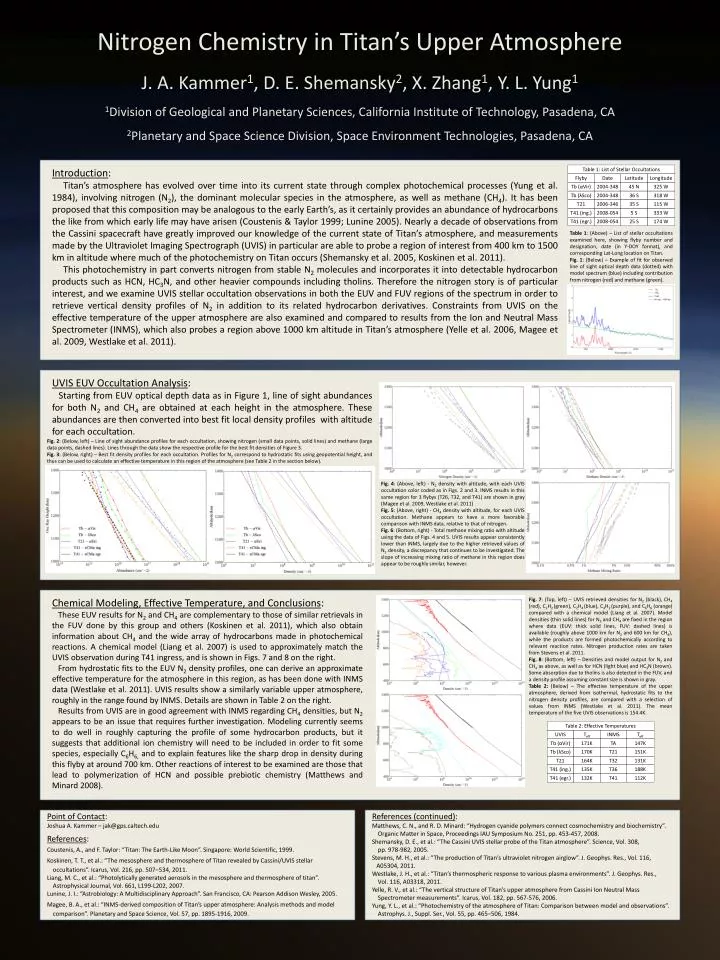
Introduction: Titan’s atmosphere has evolved over time into its current state through complex photochemical processes (Yung et al. 1984), involving nitrogen (N2), the dominant molecular species in the atmosphere, as well as methane (CH4). It has been proposed that this composition may be analogous to the early Earth’s, as it certainly provides an abundance of hydrocarbons the like from which early life may have arisen (Coustenis & Taylor 1999; Lunine 2005). Nearly a decade of observations from the Cassini spacecraft have greatly improved our knowledge of the current state of Titan’s atmosphere, and measurements made by the Ultraviolet Imaging Spectrograph (UVIS) in particular are able to probe a region of interest from 400 km to 1500 km in altitude where much of the photochemistry on Titan occurs (Shemansky et al. 2005, Koskinen et al. 2011). This photochemistry in part converts nitrogen from stable N2 molecules and incorporates it into detectable hydrocarbon products such as HCN, HC3N, and other heavier compounds including tholins. Therefore the nitrogen story is of particular interest, and we examine UVIS stellar occultation observations in both the EUV and FUV regions of the spectrum in order to retrieve vertical density profiles of N2 in addition to its related hydrocarbon derivatives. Constraints from UVIS on the effective temperature of the upper atmosphere are also examined and compared to results from the Ion and Neutral Mass Spectrometer (INMS), which also probes a region above 1000 km altitude in Titan’s atmosphere (Yelle et al. 2006, Magee et al. 2009, Westlake et al. 2011). Nitrogen Chemistry in Titan’s Upper AtmosphereJ. A. Kammer1, D. E. Shemansky2, X. Zhang1, Y. L. Yung11Division of Geological and Planetary Sciences, California Institute of Technology, Pasadena, CA2Planetary and Space Science Division, Space Environment Technologies, Pasadena, CA UVIS EUV Occultation Analysis: Starting from EUV optical depth data as in Figure 1, line of sight abundances for both N2 and CH4 are obtained at each height in the atmosphere. These abundances are then converted into best fit local density profiles with altitude for each occultation. Table 1: List of Stellar Occultations Table 2: Effective Temperatures T41 (egr.) Flyby Tb (λSco) Tb (αVir) Tb (λSco) T21 T41 (egr.) T41 (ing.) T21 UVIS Tb (αVir) T41 (ing.) 170K 164K 132K 171K 2006-346 2008-054 2004-348 Teff 2008-054 Date 2004-348 135K TA 5 S T32 35 S T36 45 N INMS T41 36 S T21 Latitude 25 S 147K Longitude 325 W 318 W 115 W 333 W Teff 112K 188K 131K 151K 174 W Fig. 2: (Below, left) – Line of sight abundance profiles for each occultation, showing nitrogen (small data points, solid lines) and methane (large data points, dashed lines). Lines through the data show the respective profile for the best fit densities of Figure 3. Fig. 3: (Below, right) – Best fit density profiles for each occultation. Profiles for N2 correspond to hydrostatic fits using geopotential height, and thus can be used to calculate an effective temperature in this region of the atmosphere (see Table 2 in the section below). Table 1: (Above) – List of stellar occultations examined here, showing flyby number and designation, date (in Y-DOY format), and corresponding Lat-Long location on Titan. Fig. 1: (Below) – Example of fit for observed line of sight optical depth data (dotted) with model spectrum (blue) including contribution from nitrogen (red) and methane (green). Fig. 4: (Above, left) - N2 density with altitude, with each UVIS occultation color coded as in Figs. 2 and 3. INMS results in this same region for 3 flybys (T26, T32, and T41) are shown in gray (Magee et al. 2009, Westlake et al. 2011) Fig. 5: (Above, right) - CH4 density with altitude, for each UVIS occultation. Methane appears to have a more favorable comparison with INMS data, relative to that of nitrogen. Fig. 6: (Bottom, right) - Total methane mixing ratio with altitude using the data of Figs. 4 and 5. UVIS results appear consistently lower than INMS, largely due to the higher retrieved values of N2 density, a discrepancy that continues to be investigated. The slope of increasing mixing ratio of methane in this region does appear to be roughly similar, however. Chemical Modeling, Effective Temperature, and Conclusions: These EUV results for N2 and CH4 are complementary to those of similar retrievals in the FUV done by this group and others (Koskinen et al. 2011), which also obtain information about CH4 and the wide array of hydrocarbons made in photochemical reactions. A chemical model (Liang et al. 2007) is used to approximately match the UVIS observation during T41 ingress, and is shown in Figs. 7 and 8 on the right. From hydrostatic fits to the EUV N2 density profiles, one can derive an approximate effective temperature for the atmosphere in this region, as has been done with INMS data (Westlake et al. 2011). UVIS results show a similarly variable upper atmosphere, roughly in the range found by INMS. Details are shown in Table 2 on the right. Results from UVIS are in good agreement with INMS regarding CH4 densities, but N2 appears to be an issue that requires further investigation. Modeling currently seems to do well in roughly capturing the profile of some hydrocarbon products, but it suggests that additional ion chemistry will need to be included in order to fit some species, especially C6H6, and to explain features like the sharp drop in density during this flyby at around 700 km. Other reactions of interest to be examined are those that lead to polymerization of HCN and possible prebiotic chemistry (Matthews and Minard 2008). Fig. 7: (Top, left) – UVIS retrieved densities for N2 (black), CH4 (red), C2H2 (green), C2H4 (blue), C4H2 (purple), and C6H6(orange) compared with a chemical model (Liang et al. 2007). Model densities (thin solid lines) for N2 and CH4 are fixed in the region where data (EUV: thick solid lines, FUV: dashed lines) is available (roughly above 1000 km for N2 and 600 km for CH4), while the products are formed photochemically according to relevant reaction rates. Nitrogen production rates are taken from Stevens et al. 2011. Fig. 8: (Bottom, left) – Densities and model output for N2 and CH4 as above, as well as for HCN (light blue) and HC3N (brown). Some absorption due to tholins is also detected in the FUV, and a density profile assuming constant size is shown in gray. Table 2: (Below) – The effective temperature of the upper atmosphere, derived from isothermal, hydrostatic fits to the nitrogen density profiles, are compared with a selection of values from INMS (Westlake et al. 2011). The mean temperature of the five UVIS observations is 154.4K. Point of Contact: Joshua A. Kammer – jak@gps.caltech.edu References: Coustenis, A., and F. Taylor: “Titan: The Earth-Like Moon”. Singapore: World Scientific, 1999. Koskinen, T. T., et al.: “The mesosphere and thermosphere of Titan revealed by Cassini/UVIS stellar occultations”. Icarus, Vol. 216, pp. 507–534, 2011. Liang, M. C., et al.: “Photolytically generated aerosols in the mesosphere and thermosphere of titan”. Astrophysical Journal, Vol. 661, L199-L202, 2007. Lunine, J. I.: “Astrobiology: A Multidisciplinary Approach”. San Francisco, CA: Pearson Addison Wesley, 2005. Magee, B. A., et al.: “INMS-derived composition of Titan’s upper atmosphere: Analysis methods and model comparison”. Planetary and Space Science, Vol. 57, pp. 1895-1916, 2009. References (continued): Matthews, C. N., and R. D. Minard: “Hydrogen cyanide polymers connect cosmochemistry and biochemistry”. Organic Matter in Space, Proceedings IAU Symposium No. 251, pp. 453-457, 2008. Shemansky, D. E., et al.: “The Cassini UVIS stellar probe of the Titan atmosphere”. Science, Vol. 308, pp. 978-982, 2005. Stevens, M. H., et al.: “The production of Titan’s ultraviolet nitrogen airglow”. J. Geophys. Res., Vol. 116, A05304, 2011. Westlake, J. H., et al.: “Titan’s thermospheric response to various plasma environments”. J. Geophys. Res., Vol. 116, A03318, 2011. Yelle, R. V., et al.: “The vertical structure of Titan’s upper atmosphere from Cassini Ion Neutral Mass Spectrometer measurements”. Icarus, Vol. 182, pp. 567-576, 2006. Yung, Y. L., et al.: “Photochemistry of the atmosphere of Titan: Comparison between model and observations”. Astrophys. J., Suppl. Ser., Vol. 55, pp. 465–506, 1984.