Download
1 / 26
260 likes | 418 Views
Database Basics. Overview of Databases. Arrivederci Pacioli. Five primary weaknesses of traditional accounting system (debits and credits): Focus on subset of business activities Delay in data capture and processing Captures limited transaction information Duplicate data

E N D
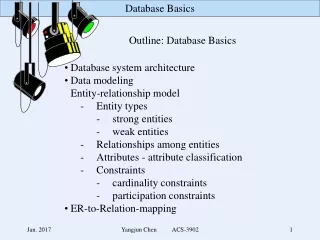
Database Basics • Overview of Databases
Arrivederci Pacioli • Five primary weaknesses of traditional accounting system (debits and credits): • Focus on subset of business activities • Delay in data capture and processing • Captures limited transaction information • Duplicate data • Expensive and defensive controls
Why is understanding relational databases important? • All modern accounting software / ERP software is supported by relational databases. • To understand how these systems operate, you need to understand relational databases. • Custom reports are created using query writing languages to pull information from the database. If you do not understand the databases, it is very difficult to create reports.
Motivation for“REA” Component • Modern IS’s run on top of databases, making it important to understand how databases store and process information. • E-R is the standard for modeling RDBMS • REA models provide an intermediate view of business processes. • Value chain, value system, and strategy are high level analyses • REA is intermediate level • Flowcharts are low level
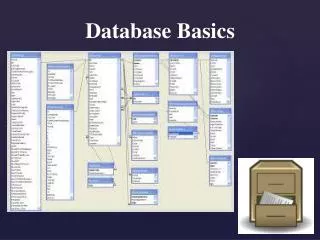
Relational Data Bases • We correct these problems by adding another table to create a “normalized” data base • Data duplication is minimized • Note the “linked” primary key in the Sales-Inventory table
Normalization example—tables Purchase PO number Purchasing agent ID Date ordered Shipping terms Shipping date Vendor ID Purchase-Item Item number PO number Quantity ordered • Vendor • Vendor ID • Vendor Name • Vendor Address • Discount Percentage • Discount Time • Item • Item number • Item description • Item price
Entity-Relationship (E-R) Modeling • E-R Modeling is one of many ways to draw pictures of businesses. • Other modeling choices include: • Data flow diagrams (DFD) • Flowchart • E-R modeling is an ART—may be a bit of a stretch...it is not a science.
Entity-Relationship—(E-R) Modeling • Entities represent • People • Places • Things • Occurrences in time (like transactions) • Relationship • Link related entities
E-R Modeling Example • Hospital surgery room environment • Operations are performed on patients. One doctor performs the operation while being assisted by several nurses.
E-R Example Doctor Operating Room Operation Nurse Patient
REA vs. E-R • The REA framework says that the world consists solely of Resources, Events, and Agents (Locations?) • E-R modeling is a method of drawing pictures.
REA Diagrams • McCarthy (1979, 1982) determined that business systems consist “solely” of • Resources • Events • Agents • McCarthy (1979, 1982) also identified common patterns of Resources, Events, and Agents Inside Agent Resource Event Outside Agent
REA Diagrams • Resource - anything under the firm’s control, that provides value and of which there is limited quantity • Event - an occurrence that changes the quantity of a resource • Agent - someone responsible for the event. One is from the organization (internal) the other is outside (external) • Location - where the event occurred—sometimes included
REA “Exchange” Pattern • Decrease events are always linked to increase events - Duality • No “free lunch” - firms do not give up resources without receiving something Inside Agent Resource Decrease Event Outside Agent Inside Agent Resource Increase Event Outside Agent
Integrated REA Diagrams • Exchange REA Diagrams are combined to create an integrated REA Diagram. Inside Agent Inside Agent Increase Event Resource Decrease Event Outside Agent Outside Agent Inside Agent Inside Agent Decrease Event Resource Increase Event Outside Agent Outside Agent
Integrated REA Diagrams • Complete Integrated REA Diagrams include an increase event and a decrease event for each resource. • Resources must come from somewhere • Resources must go somewhere • May choose not to model complete system. • This is a new model, new field, developing field...but the concepts are well-accepted in the database field • UN/CEFACT (Center for Trade Facilitation) • ISO
REA Data Modeling Process • REA framework - provides conceptual model • Tables - Identify required tables and fields • Database - Build tables, establish relationships, and input data into relational database
Cardinalities • Definition: the number of times each individual entity can participate in the relationship • Relationships between entities determine how tables must be related...entities lead to tables
Cardinalities • Maximums • Business process • Rules for relationships in database • Minimums • Business process • Information for controls in database
Emergency RoomE-R Example • Doctor - Operation: • A doctor can have manyoperations • An operation can have oneresponsibledoctor • Nurse - Operation • A nurse can have manyoperations • An operation can have manynurses
Steps in REA data modeling • Identify the business processes • Identify the resources affected by each event and the agents who participate in each event • Combine events into the basic exchange template • Add information about cardinalities • Identify magnitude of relationships • Implement Model in Relational Database: • Table for each entity • Table for each M:N relationship • Use foreign keys for 1:1 and 1:N relationships • Develop a set of normalized tables
Queries—putting it back together • Some query basics • Database languages...data definition, data manipulation, data query • Data dictionary...to see what the data look like • Structured query language (SQL)...standardized query language with many specializations