Download
1 / 8
80 likes | 163 Views
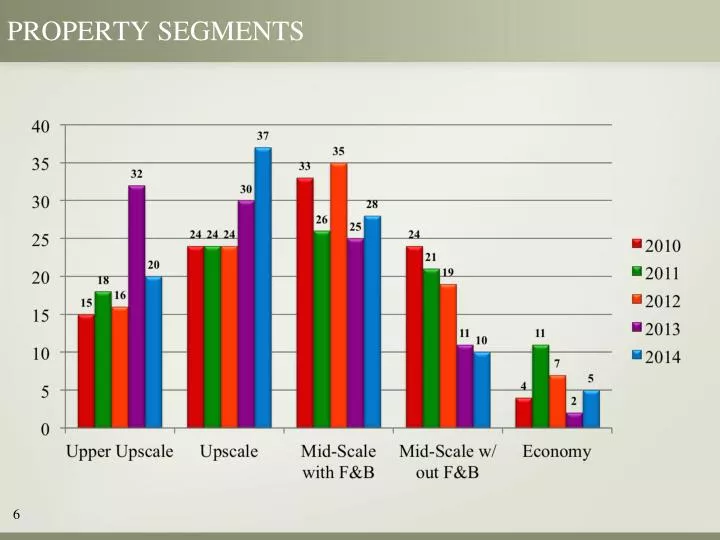
PROPERTY SEGMENTS. 6. CURRENT HOTEL PROJECTS. 7. OVERALL VENDOR LEAD TIMES. 8. PROJECT SCHEDULES. 9. CURRENT BUDGETS YEAR-TO-YEAR. 10. BUSINESS GROWTH – CHANGE IN NUMBER OF PROJECTS. Past 12 Months Next 12 Months. Up Same Down. 11. SUMMARY.

E N D
BUSINESS GROWTH – CHANGE IN NUMBER OF PROJECTS Past 12 Months Next 12 Months Up Same Down 11
SUMMARY • From 2004 to 2014, warehouse use almost doubled from 41% to 78% (and of course, shipped direct to the hotel had the corresponding drop). • From 2004 to 2014, our work outside N. America increased from just 1% to 12%. • From 2004 to 2014, the number of new vendors the purchasing agents use almost doubled from 25% to 46% • For 2014 we have a record negative stat: Only 37% (the lowest ever recorded in the history of the survey) of the specs received by the purchasing agents are “accurate and complete,” so that means about 2/3 of all the specs are… 12
SUMMARY • Over half the work is in the top end of the market, the upper upscale and upscale segments. • Over 70% of the projects are renovations of branded/chain hotels. • “Chart Changing” all time record vendor lead times. Let me repeat again, all time record vendor lead times. • For 2014, we have decreasing schedules and increasing budgets. • 91% of the ISHP members think business will be up in 2014, with only 3% thinking business will be down in 2014. • So, in Summary for 2014: We have a group of optimistic purchasers, starting with mostly incomplete and inaccurate specs, spending more money to try to get products that take longer to produce, shipped faster. 13