Download
1 / 23
230 likes | 248 Views
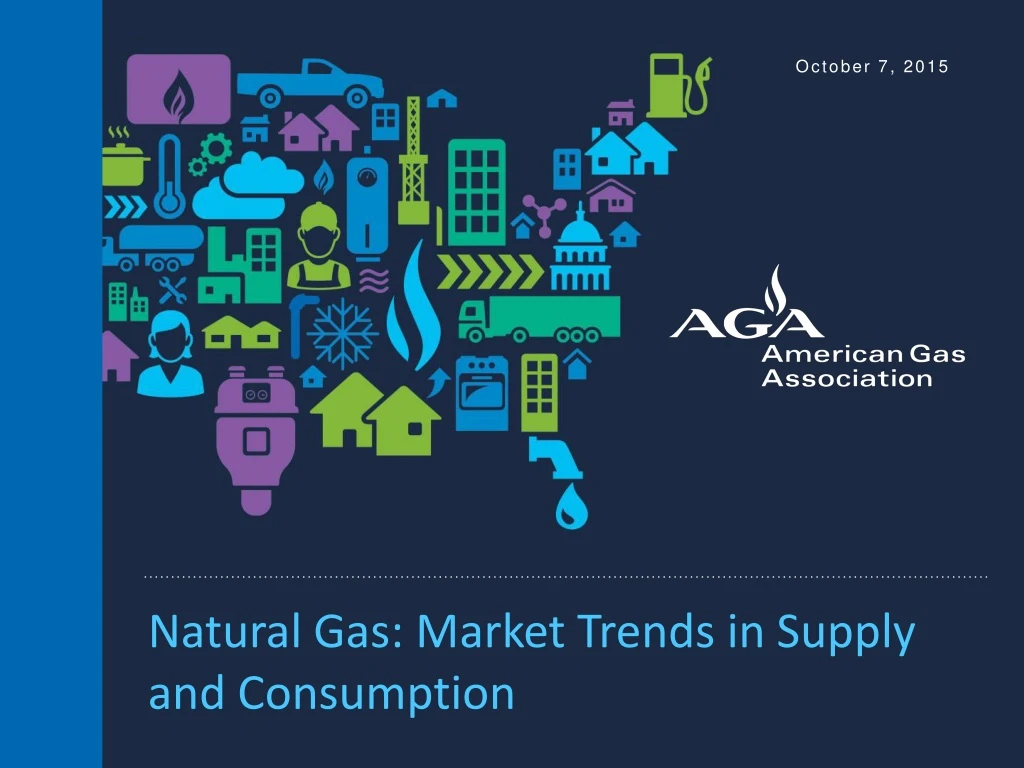
Explore the latest trends in natural gas supply and consumption in the United States, including downstream delivery systems, record production levels, and efficiency success stories. Learn about residential gas use, CO2 emissions, value chain leakage rates, and policy actions shaping the industry.

E N D
October 7, 2015 Natural Gas: Market Trends in Supply and Consumption
Who We Are • Founded in 1918, American Gas Association represents more than 200 local energy companies that deliver clean natural gas throughout the United States • More than 71 million residential, commercial and industrial natural gas customers in the U.S., of which 94 percent - more than 68 million customers - receive their gas from AGA members
Downstream Natural Gas Delivery System
Natural GasGetting It to Homes, Businesses andto Work for America Upstream
Record Production Levels in 2015 Source: Bentek Energy LLC
Outcrop – Utica Shale Source: www.wikipedia.org/wiki/Utica_Shale.
US Shale Gas Production Source: US Department of Energy, Energy Information Administration.
North American Production Outlook by Area Dry gas production (Bcfd) Rig count, select areas Source: Bloomberg New Energy Finance. Note: Rig count should not be viewed as comprehensive as not every play modelled.
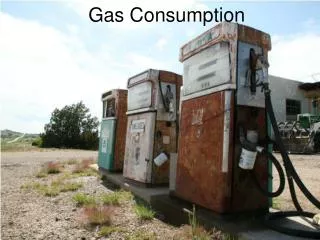
US Natural Gas Consumption 2014 Source: Bentek Energy.
Total Peak Day Natural Gas Consumption2007-2015 Source: Bentek Energy
Residential Natural Gas Use:An Efficiency Success Story Natural gas usage per household has decreased even as overall demand for energy has risen. This trend is due in part to installation of tighter-fitting windows and doors, better insulation, utility sponsored energy efficiency programs, and the development of increasingly more efficient natural gas appliances. Sales Customers
Cumulative Growth in Residential Burner Tips by Type1993 - 2013 Source: American Housing Survey 1993 - 2013, US Census Bureau
Ratepayer-Funded Natural Gas Efficiency Programs in 2013112 Active in 39 States & 6 in Canada Source: AGA Natural Gas Efficiency programs Survey.
Growth in CO2 Emissions Has Been Driven by Greater Electricity Use Source: Energy Information Administration
More nuclear and hydro in grid mix. Source: MIT Future of Natural GasAppliance efficiencies Energy STAR compliant.
Only 0.24% Natural Gas Value ChainEmissions Leakage Rates of produced natural gas is emitted from systems operated by natural gas utilities Production 130 Bcf 0.41% Processing 122 Bcf 0.38% Transmission & Storage 84 Bcf 0.27% Distribution 66 Bcf 0.24% Approximately 1.3% of gross natural gas production (31 Tcf) is estimated to be emitted throughout the supply chain. Source: U.S. Department of Energy and U.S. Environmental Protection Agency
Natural gas systems represent a small share of annual GHGs its inception in 1993. Source: EPA GHG Inventory 2013
Emissions Have Declined Even as Pipelines Have Expanded Replacing pipelines with protected steel and plastic materials can reduce emissions more than 95%.
EPA and Other Policy Actions • Section 433 – 2007 energy legislation requiring elimination of fossil fuels from government buildings and installations • Boiler Rule – Air toxics on industrial and other boiler applications • EPA 111(b) and 111(d) emissions rules new source and existing source power plants • DOE Furnace Rule
Find Us Online www.aga.org www.truebluenaturalgas.org http://twitter.com/AGA_naturalgas www.facebook.com/naturalgas www.linkedin.com/company/50905?trk=tyah Brendan O’Brien Energy Analyst, Policy Analysis bobrien@aga.org 202.824.7220