Download
1 / 17
170 likes | 368 Views
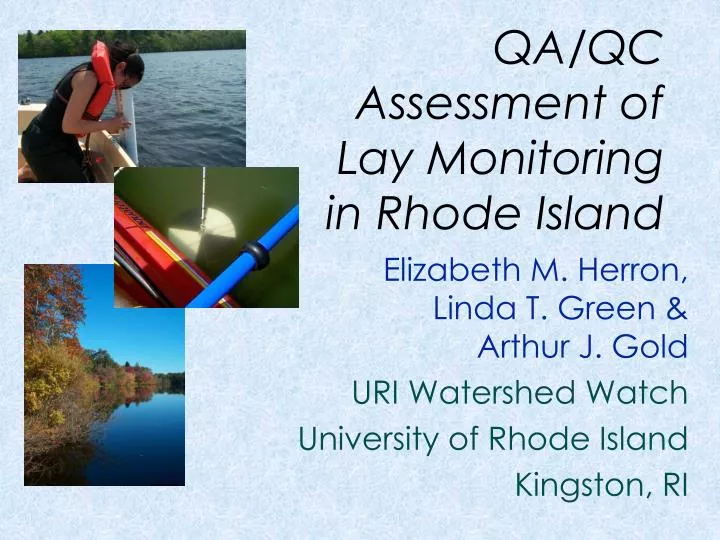
QA/QC Assessment of Lay Monitoring in Rhode Island. Elizabeth M. Herron, Linda T. Green & Arthur J. Gold URI Watershed Watch University of Rhode Island Kingston, RI. University of Rhode Island Cooperative Extension Watershed Watch Program. Begun in 1988 with 14 lakes

E N D
QA/QC Assessment of Lay Monitoring in Rhode Island Elizabeth M. Herron, Linda T. Green & Arthur J. Gold URI Watershed Watch University of Rhode Island Kingston, RI
University of Rhode Island Cooperative ExtensionWatershed Watch Program • Begun in 1988 with 14 lakes • Now monitors +200 sites on +100 waterbodies with ~350 volunteers • Provides +90% of RI’s lake multi-year baseline data
Volunteer Monitoring Program for Lake Water Quality Assessment Rigorous assessment of lay monitoring data to justify inclusion in 305(b) Report
Objectives: • To determine if volunteers collect data statistically similar to professionally collected data • To determine if the URI Watershed Watch protocol produces data as representative of water quality as US EPA approved protocol
Field QA/QC Visits • 21 Lay-monitored public lakes • Observation of all monitoring activities • Collection and analysis of water samples
Methods: • Volunteer collected water samples following URIWW protocol • Staff collected water samples following URIWW protocol with the volunteers’ equipment • Staff collected duplicate samples following EPA approved protocol
Protocol differences: URIWW protocol:Discrete single samples collected at 1M and 5M depths; dissolved oxygen determined with kits. EPA protocol:Integrated duplicate epilimnetic and discrete duplicate mid-hypolimnetic samples collected; dissolved oxygen/temperature profiles determined with a meter.
Field Analyses Secchi Depth Water Temperature Dissolved Oxygen Chl. - a Processing
Laboratory analyses Alkalinity pH Total Phosphorus Chlorophyll - a Sodium Chlorides Calcium Magnesium
Statistical Analyses Mean difference Standard deviation of the mean difference Standard error of the mean difference 95% Confidence Interval of mean difference Quartiles Range Regression Percent error
Secchi Comparison Plot = 1:1 Volunteers R2 = .96 Depth (m) Staff
Results Summary • No statistically significant differences for parameters monitored • Soluble constituents were least variable • Particulate based constituents were more variable • The degree of variability was approximately the same for each protocol for a given parameter
Implications • URIWW data is of sufficient quality to be included in the 305(b) as Monitored data • The time and cost of duplicate water sampling may not be justified for most parameters • Duplicate sampling for chlorophyll may be justified
Trained volunteers following the URIWW protocol collect data as representative of lake water quality as do professionals following a US EPA approved protocol
Resulting Program Changes • Moved deep sampling depth from 5M to 1M from the lake bottom • Replicate filters from duplicate samples for chlorophyll - a analysis
305 (b) Implications • URIWW data is used as “Monitored” data in the 305 (b) • URIWW data indicating declining water quality has initiated 319 and TMDL studies • URIWW collaborates with numerous groups and agencies including US EPA, NWS, USGS, and NRCS