Download
1 / 51
510 likes | 525 Views
Explore advanced methods for optimizing pedestrian and vehicular flow in complex facilities using dynamic modelling and case studies. Understand congestion, performance measures, and design variables crucial for circulation systems. Analysis and synthesis of results for effective implementation.

E N D
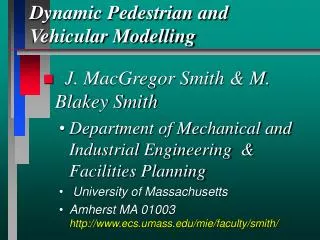
Dynamic Pedestrian and Vehicular Modelling • J. MacGregor Smith & M. Blakey Smith • Department of Mechanical and Industrial Engineering & Facilities Planning • University of Massachusetts • Amherst MA 01003 http://www.ecs.umass.edu/mie/faculty/smith/
Overview • Methodology • Representation • Analysis • Synthesis • Case Studies • Newton-Wellesley Hospital Campus • Engineered Polymers Warehouse Facility • Automated Teller and Walkup Facility
Representation Step 1.0: Define Customer Classes Step 2.0: Define Routing vectors Step 3.0: Define Distance and Flow Matrices Analysis Step 4.0: Topological Diagrams Step 5.0: Layout Alternatives Step 6.0: Flow Analysis Synthesis Step 7.0: Evaluation of Alternatives Step 8.0: Synthesis Step 9.0: Implementation Basic Methodology
Representation • Step 1.0: What customers (patients, staff, visitors) are moving through the facility? • Step 2.0: Define the route sheets for the customer classes • Step 3.0: From-To Charts, Distance and Flow Matrices: P(i,j); D(i,j)
Analysis • Step 4.0: Generate the topological diagram relating the route sheets and the physical facility. • Step 5.0: Generate the alternative layouts • STEP/MAFLAD • Step 6.0: Generate the analytical and simulation models for analysis • QNET/ARENA
Synthesis • Step 7.0: Evaluation of Alternatives • Step 8.0: Synthesis of Results (sensitivity analysis) • Step 9.0: Implementation of Plans
Design Issues • What are the fundamental design and performance variablesinvolved in designing a circulation system? • How are these fundamental design (d), performance (p), and contextual (c) variables related? P=f(c,d)
What is Congestion? • Congestion occurs mainly as a result of increased number of pedestrians and vehicles competing for the limited space of a corridor or roadway segment.
Empirical Model • The service rate (speed) decays within a corridor • Since there is a finite amount of available space within each corridor, the density of pedestrians reaches an upper limit (jam density).
Performance Measures • Flow (q) Output volume or throughput • Density (k)the number of customers or vehicles travelling over a unit length • Pedestrian Speed () • Time (t)
Design Variables • Length (L) of the corridor or highway segment • Width (W) of corridor or highway segment. • Capacity (C) = 5 LW • Other variables of interest e.g. • pavement materials, patterns, etc. • grades, stairs, etc. • geometric curves, etc.
Contextual Variables • Input Volume ():= total number of pedestrians that enter a circulation segment during a given time interval • Other contextual variables • obstacles, • weather conditions • climate • wind conditions
Building Blocks Methodology Public Buildings • Airports • Courthouses • Hospitals • Malls • Campuses • Freeways
LinearModel • A:= average pedestrian or vehicle speed • C: capacity of the corridor or highway segment C = f(L,N)
ExponentialModel • := scale parameter • := shape parameter
Empirical Curves of Pedestrian Stairwell Flows (after Fruin)
Representation of Facilities • Floor Plan/Section Graph Representation
Engineered Polymers Inc. • Warehouse capacity analysis • Dynamic material handling design • Layout and equipment needs • Forecast space utilization over time • Bottleneck analysis • Over to Simulation model animations …
Warehouse Capacities • Raw materials Semi-Finished
Holyoke Power and Light • Pedestrian vehicular layout alternatives • Horseshoe Counter with 1 ATM • Horseshoe Counter with 2 ATMs • Linear Counter • L-Shaped Counter • Animations of different alternatives • Summary of results
Basic Data • Cashiers • 128 drive-ups /day, Ave Time: 1 min 9 sec • 290 walk-ins /day, Ave Time: 1 min 18 sec • Credit • 12 walk-ins /day, Ave Time: 6.42 min • 27 call-ins / day, Ave Time: 3.78 min • Customer Accounts • 36 walk-ins /day, Ave Time: 4.30 min • 37 call-ins /day, Ave Time: 2.54 min • Water Dept: 5% of 8100 customers /month
Assumptions • 70% customers enter via parking lot, 30% enter via Suffolk Street • If cashiers are backed up, computer entries are postponed until they are free • Cashiers operate on the policy of First-Come-First-Served when serving both walk-ins and drive-ups • With Water Dept, an additional cashier is available, and all cashiers handle all types of customers
Simulation Experiments • Results analyzed over 30 independent days of operation • Simulation programs written in SIMAN and animations developed in ARENA • Animations shown for each alternative over 1 day (8 hours) of operation • Over to animations .....
Representation Step 1.0: Define Customer Classes Step 2.0: Define Routing vectors Step 3.0: Define Distance and Flow Matrices Analysis Step 4.0: Topological Diagrams Step 5.0: Layout Alternatives Step 6.0: Flow Analysis Synthesis Step 7.0: Evaluation of Alternatives Step 8.0: Synthesis Step 9.0: Implementation Methodology Summary