Download
1 / 10
110 likes | 358 Views
Crystal Violet A Psuedo 1st Order Reaction. Experiment #45. Introduction. Purpose : Note the relationship between the change in concentration of a reactant with respect to time for a First Order Reaction and compute half-life for a decomposition reaction. The Rate Law.

E N D
Crystal VioletA Psuedo 1st Order Reaction Experiment #45
Introduction • Purpose: Note the relationship between the change in concentration of a reactant with respect to time for a First Order Reaction and compute half-life for a decomposition reaction.
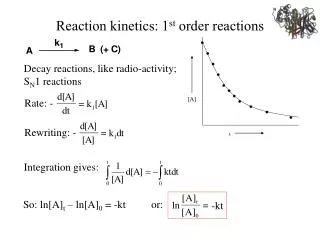
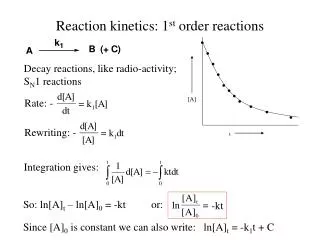
The Rate Law • The Rate Law tells us how the rate of a reaction changes as we change reactant concentration. • If the reaction is First Order, then changes in concentration of that substance produce proportional changes in the rate.
Today’s Reaction CV+ + OH - CV-OH complex [ 5 x 10 –5 M ] [0.1 M] purple clear • Note: OH- is in such a greater concentration as compared to the concentration of the CV+; therefore the concentration of the OH – does not appreciably change. The OH – concentration is included in K.
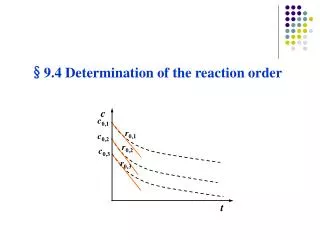
PART 1: Calibration Data • A Calibration Graph is a reference for us to • The following calibration graph tells us what the absorbance will be when we change the concentration of crystal ciolet
PART 2: The Specific Rate Constant • Warm up Spec 20, set wavelength to 570 nm, calibrate, • Review procedure in Lab Manual CV: 3 ml H20: 3 ml NaOH: 1.5 ml
Post Lab Assignment • Construct graphs (3) using Graphical Analysis or Excel. Include: name, date, section, exp. #. • calibration graph • Ab vs Time • Log Ab (or ln Ab) vs time • Solve for K using graph 3. • Solve for T ½ on graph two. • Using graph C, find the concentration at 600 seconds
Question 2 • Method One: Solve for K using Graph 3, find the slope (m) using computer functions • Find K when Rate = K [CV+] • when you plot this graph on GA ask for Statistical Analysis. The computer will give you the slope (m). • If you use natural log (Ln) on y axis, the slope equals -K • (LnA= (-K) T + Ln A)
Question 2(cont) m= -.04 • If you use Log • Off of the computer graph (log) • m= -.04 Log A Time Log A= (T) + Log A y= m x + b y axis= slope x axis + y intercept
Question 2: Using data X1 , Y1 ( 1min., -.04) log A X2, Y2 (20 min., -.70 ) Time log Af= (T) + log Ai y= m x + b y axis= slope x axis + y intercept