Download
1 / 13
130 likes | 142 Views
Develop Bayesian models to predict plant species distribution patterns in the Cape Floristic Region. Collaborative effort for early detection and rapid response to invasive species. Utilize Protea Atlasing data for detailed mapping.

E N D
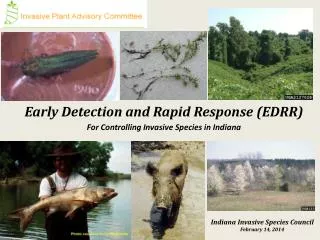
An Early Detection and Rapid Assessment Network for Plant Invasions
Predictive Modeling of Species Distributions and Early Detection • A Regional Approach to Early Detection and Rapid Response – IPANE • An Information Network for Early Detection and Rapid Response – Local to National Levels
Predictive Modeling of Species Distributions:Applications to Invasives
Protea Atlasing Protea altasing in the field Field forms mapping
Protea Atlas sample sites across the Cape Floristic Region ~60,000 sites, ~250,000 species-site records, globally one of the most intensively sampled group of species for any biogeographic region.
Cape Floristic (Biogeographic) Region 90,000 km2 9000+ plant species 70% found nowhere else 1400+ threatened or endangered species
Objective: to develop Bayesian hierarchical regression models to explain and predict species distribution patterns
We use the Bayesian perspective to model predictions: • Bayesian inference answers the question: “How probable are my hypotheses, given my data?”(i.e. P(H|data)). • Versus the classical, frequentist perspective that answers the question: “How probable are my data give my (null) hypothesis?”(i.e. P(data|H)). Rev. T. Bayes Sir R.A. Fisher
How does the Bayesian perspective work: • We may have some prior expectations about the outcome of an experiment, the parameters of the model, or the confidence that an hypothesis is correct before any data are examined: prior probability. • These probabilities are modified in light of the data available providing: posterior probability or confidence in the hypothesis. • Use Bayes theorem: • [posterior probability that the Ho is correct, given the data] ~ • [probability that data would be observed, given the Ho] X • [ the prior probability that Ho was correct, before any data were collected]: • p(Ho|data) ~ p(data|Ho) * p(Ho)
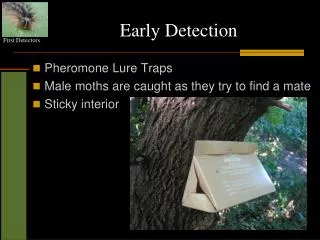
Simple conceptual example: predict the distribution of spotted owls in the NW with some degree of confidence. We know that owls are rare in the forested landscape; prior experience may indicate that the probability of finding them in any particular forest is .05 But, by including data on their ecology can we have increased confidence in detecting their presence? For example we may hypothesize that they nest in snags. We can evaluate this by gathering observations p/a of owls in forests w/ and w/o snags. Example forest survey data:
Set up as a Bayesian model: • Posterior prob. of owls, given snags ~ prob. of snags, given owls * prior prob. of owls: For above example, the probability of finding owls in forests given snags: • Versus usual frequentest perspective: • There is a high probability that owls are not distributed at random among forests (w/ and w/o snags) p<0.0001, or that there is a strong relationship between no snags and no owls.