Download

1 / 17
170 likes | 289 Views
Tropical Cyclone Intensity Change Predictability Estimates Using a Statistical-Dynamical Model. Mark DeMaria NOAA/NESDIS/ StAR , Fort Collins, CO AMS Tropical Conference Tucson, AZ May 10-14, 2010. Outline. Background information Charlie Neumann (1987) methodology

E N D
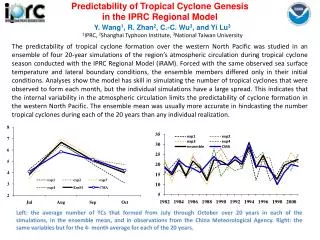
Tropical Cyclone Intensity Change Predictability Estimates Using a Statistical-Dynamical Model Mark DeMaria NOAA/NESDIS/StAR, Fort Collins, CO AMS Tropical Conference Tucson, AZ May 10-14, 2010
Outline • Background information • Charlie Neumann (1987) methodology • Use of statistical-dynamical models for predictability estimates • Recent updates to the SHIPS and LGEM statistical-dynamical intensity models • Predictability results
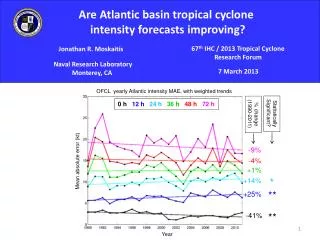
NHC 48 h Atlantic Track and Intensity Errors 1985-2009 Track 63% Improvement in 24 yr Intensity 9% Improvement in 24 yr HFIP Goals: 20% in 5 yr, 50% in 10 yr
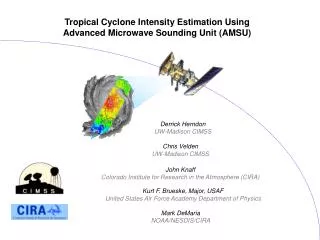
Operational Intensity Forecast Models 2007-2009 Intensity Errors • GFDL (95) and HWRF (07) • 3-D coupled ocean atmosphere models • SHIPS (91) and LGEM (06) • Statistical-dynamical models
C. J. Neumann (1987)Prediction of Tropical Cyclone Motion: Some Practical Aspects • Most accuratetrack models were statistical-dynamical • Track error improvement ~0.5% per year • Error reductions leveling off • How much can track forecasts be improved? • Run NHC83 statistical-dynamical model with “perfect prog” input and compare runs with operational input • Showed 50% improvements were possible
Intensity Predictability Study • Use LGEM statistical-dynamical model • Run 4 versions • V1. NHC forecast tracks, GFS forecast fields • Operational input • V2. NHC forecast tracks, GFS analysis fields • V3. Best track positions, GFS forecast fields • V4. Best track position, GFS analysis fields • V1. Provides current baseline • V4. Provides predictability limit • V2. Evaluates impact of large-scale improvement • V3. Evaluates impact of track improvement
The Logistic Growth Equation Model • Uses analogy with population growth modeling • dV/dt = V - (V/Vmpi)nV • (A) (B) (C) • (A) = time change of maximum winds • Analogous to population change • (B) = growth rate term • analogous to reproduction rate • (C) = Limits max intensity to upper bound • Analogous to food supply limit (carrying capacity) • , n = empirical constants • Vmpi= maximum potential intensity (from empirical SST function) • = growth rate (estimated empirically from ocean, atmospheric predictors GFS,satellite data, etc)
Forecast Procedures • Use 2010 version of LGEM fitted to 1982-2009 developmental sample • Predictability analysis for Atlantic 2002-2009 sample • 135 tropical cyclones • 2402 forecasts to at least 12 h • 859 forecasts to 120 h • Compare LGEM with operational input to combinations of “perfect prog” track and GFS • Forecast verification using standard NHC rules
New LGEM (and SHIPS) Input • Generalized Shear (GS) P2 GS = 4/(P2-P1)∫ [(u-ub)2 + (v-vb)2]1/2 dP P1 P1=1000 hPa, P2=100 hPa, ub,vb = mean u,v in layer • 850-200 hPashear direction parameter • NE shear in low-lat, SW shear in high-lat less detrimental for intensification
Regions with Most Favorable Shear Directions for Hurricane Ike
2002-2009 Intensity Errors OFCL = NHC operational forecasts Ver 1 = LGEM w\ oper input Ver 2 = LGEM w\ perfect GFS Ver 3 = LGEM w\ perfect tracks Ver 4 = LGEM w\ perfect tracks + GFS
LGEM Improvements over LGEM w\ Operational Input Perfect GFS Perfect track Perfect GFS & track
Illustration of Track Error1000 plausible Hurricane Ike tracks/intensities based on recent NHC forecast errors
Additional Improvements • TPW , Lightning density, µ-wave imagery input • Knaff et al., Velden et al., this conference • Adjoint of LGEM to include storm intensity history up to forecast time • Consensus/ensembles • Dynamical model improvements under HFIP
2-hourly Composite Lightning StrikesHurricane Ida 8 November 2009
Conclusions • Current intensity forecast properties similar to those for track in 1980s • Neumann (1987) track predictability framework applied to intensity problem • LGEM statistical-dynamical model run with “perfect prog” input • 4%, 8%, 17%, 28%, 36% improvement at 1-5 day • About ½ might be realizable • Majority of intensity improvement from reducing track errors