Download
1 / 8
80 likes | 94 Views
Learn how to measure the center and spread of a dataset using quartiles, range, and percentiles, as well as how to identify suspected outliers using the 1.5 × IQR rule. Also, discover the five-number summary and how to create a boxplot.

E N D
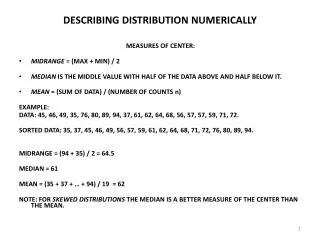
Describing Distribution with Numbers • Measuring the “CENTER”
Quartile: Data partition in a data set: Q1, M, Q3 Measuring the spread which is the difference between the largest and smallest observations RANGE: such that p percent of the observations fall at or below it Percentile:
To calculate the QUARTILES • Arrange the observation in increasing order and locate the MEDIAN • Locate the first quartile Q1: Median of the 1st half • Locate the third quartile Q3: Median of the 2nd half
Q1 M Q3 =25 =34 Quartiles are RESISTANT measure of the spread =41 M Q1 Q3 Example: Barry Bonds home runs Bonds’
Call an observation a suspected outlier if it falls more than 1.5 × IQR above the third quartile or below the first quartile. The 1.5 × IQR Rule for Suspected Outliers IQR: INTERQUARTILE RANGE IQR is the distance between the Q1 and Q3 1QR= Q3 - Q1
M Q1 Q3 Let’s find the suspected outliers IQR= 41-25 = 16 Q1 - 1.5(IQR) Lower cutoff Upper cutoff Q3 + 1.5(IQR) 41 + 1.5(16) 25 - 1.5(16) 41 + 24 25 - 24 1 65
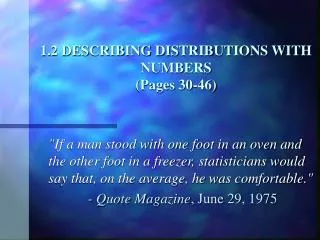
M Q1 Q3 Five-number Summary and boxplots The set of observation that consists of: These five numbers offer a reasonably complete description of center and spread.
41 25 34 73 16 Boxplot: graph of the 5-number summary