Download
1 / 1

E N D
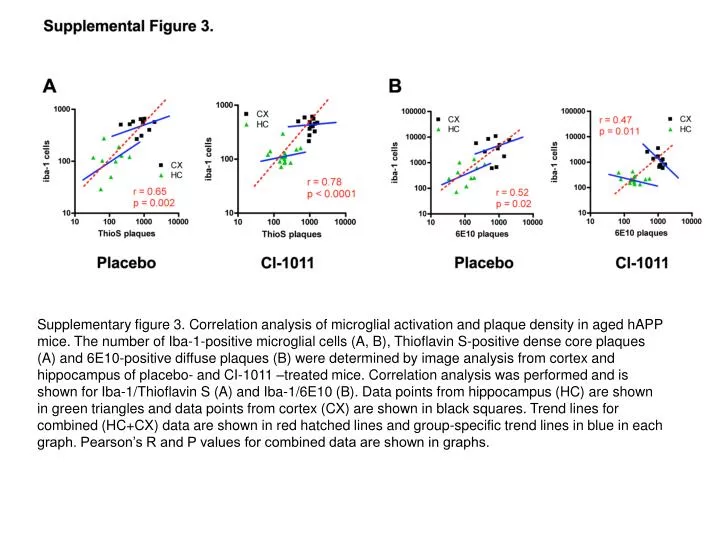
Supplementary figure 3. Correlation analysis of microglial activation and plaque density in aged hAPP mice. The number of Iba-1-positive microglial cells (A, B), Thioflavin S-positive dense core plaques (A) and 6E10-positive diffuse plaques (B) were determined by image analysis from cortex and hippocampus of placebo- and CI-1011 –treated mice. Correlation analysis was performed and is shown for Iba-1/Thioflavin S (A) and Iba-1/6E10 (B). Data points from hippocampus (HC) are shown in green triangles and data points from cortex (CX) are shown in black squares. Trend lines for combined (HC+CX) data are shown in red hatched lines and group-specific trend lines in blue in each graph. Pearson’s R and P values for combined data are shown in graphs.