Download
1 / 29
330 likes | 690 Views
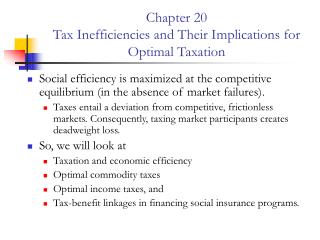
Tax Inefficiencies and Their Implications for Optimal Taxation. 20.1. Taxation and Economic Efficiency. Graphical Approach. 20.1. Taxation and Economic Efficiency. Elasticities Determine Tax Inefficiency. Efficiency Effects of a Fertilizer Tax: Example. D for Fert: Qd=240-6P

E N D
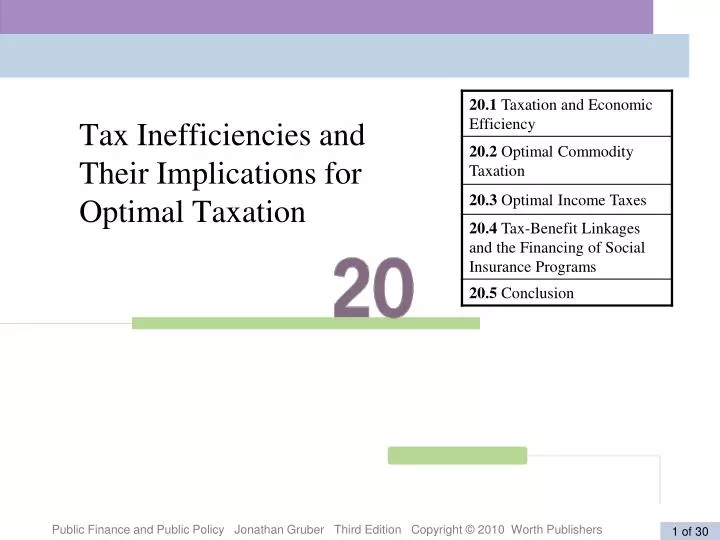
Tax Inefficiencies and Their Implications for Optimal Taxation
20.1 Taxation and Economic Efficiency Graphical Approach
20.1 Taxation and Economic Efficiency Elasticities Determine Tax Inefficiency
Efficiency Effects of a Fertilizer Tax:Example D for Fert: Qd=240-6P S of Fert: Qs=-60+4P A $4 tax is imposed on fertilizer producers Illustrate the effect of this tax on producers Find the initial and new equilibrium pts Calculate the DWL Find producer and consumer share What is the revenue generated?
20.1 Taxation and Economic Efficiency Elasticities Determine Tax Inefficiency The inefficiency of any tax is determined by the extent to which consumers and producers change their behavior to avoid the tax; deadweight loss is caused by individuals and firms making inefficient consumption and production choices in order to avoid taxation.
The real tax avoidance scandal centers on dividends and capital gains By Robert J. Samuelson, Sunday, April 3, 7:53 PM • GE :$14.2 billion in WW profits, no US taxes • $5.1 billion pre-tax profits US –previous losses carried forward • -Tax avoidance –files taxes in 250 jurisdictions, steers profits to low tax countries • Solution: lower corporate taxes, raise capita gains tax and tax dividends at ordinary income rate
APPLICATION 20.1 Taxation and Economic Efficiency Tax Avoidance in Practice 1. The British boat designer Uffa Fox lived in a home he constructed from a floating bridge. When the Inland Revenue (Britain’s tax collectors) attempted to collect property tax on the home, Fox began sailing it up and down the river. By the time he was done, Fox had collected so many different addresses that the Inland Revenue gave up their attempts. 2. An Englishman visiting Cyprus in the early 1980s asked a tour guide why so many of the houses seemed to have steel reinforcement bars jutting out from their top floors. The guide informed him that Cyprus had a building tax that applied only to finished structures. Owners of those houses could thus claim that they were still in the process of finishing the roof. 3. The Thai government levies a tax on signs in front of businesses. The tax is levied only on external signs and the rate depends on whether the sign is completely in Thai (low), in Thai and English (medium), or completely in English (very high). A walk around Bangkok thus reveals many businesses hanging English signs with a small amount of Thai writing in the upper-right-hand corner. Some businesses manage to avoid the tax entirely by printing the message on curtains that are hung in the front window, rendering the sign “internal” and thus tax-exempt.
20.1 Taxation and Economic Efficiency Determinants of Deadweight Loss
20.1 Taxation and Economic Efficiency Determinants of Deadweight Loss The formula for DWL is More elastic, bigger the dwl marginal deadweight loss The increase in deadweight loss per unit increase in the tax.
20.1 Taxation and Economic Efficiency Deadweight Loss and the Design of Efficient Tax Systems A Tax System’s Efficiency Is Affected by a Market’s Preexisting Distortions preexisting distortions Market failures, such as externalities or imperfect competition, that are in place before any government intervention.
20.1 Taxation and Economic Efficiency Deadweight Loss and the Design of Efficient Tax Systems A Tax System’s Efficiency Is Affected by a Market’s Preexisting Distortions
20.1 Taxation and Economic Efficiency Deadweight Loss and the Design of Efficient Tax Systems Progressive Tax Systems Can Be Less Efficient
20.1 Taxation and Economic Efficiency Deadweight Loss and the Design of Efficient Tax Systems Progressive Tax Systems Can Be Less Efficient Why is the deadweight loss larger for the higher-wage worker despite the same reduction in hours worked? Because in a competitive labor market, the wage rate equals the marginal product of labor, so the high-wage worker has a higher marginal product of labor. As a result, society loses more efficiency when the high-wage worker reduces her hours (at a marginal product of $20 per hour) than when the low-wage worker reduces her hours (at a marginal product of $10 per hour). The guiding principle for efficient taxation is to create a broad and level playing field ratherthan taxing some groups or goods particularly highly and others not at all.
APPLICATION 20.1 Taxation and Economic Efficiency The Deadweight Loss of Taxing Wireless Communications Hausman (2000) estimated the deadweight loss from a particularly dynamic sector of our economy: wireless communications services: • In 1999, the state and federal tax burden on wireless communication in the typical state was 14.5%, although the rate was 25% in high-tax states. • Hausman estimated that for every dollar the government raised in taxes, social welfare was reduced by 53¢. This figure is high for three reasons: • Demand for wireless communications is fairly price sensitive. • There is already a large preexisting distortion in this market. • The taxes are fairly high, and the marginal deadweight loss rises with the tax rate. • Hausman estimated that the marginal deadweight loss caused by an additional tax on wireless services ranged from 72¢ to 90¢ per dollar raised.
20.2 Optimal Commodity Taxation Ramsey Taxation: The Theory of Optimal Commodity Taxation optimal commodity taxation Choosing the tax rates across goods to minimize deadweight loss for a given government revenue requirement. Ramsey Rule To minimize the deadweight loss of a tax system while raising a fixed amount of revenue, taxes should be set across commodities so that the ratio of the marginal deadweight loss to marginal revenue raised is equal across commodities. Tax inelastic goods more value of additional government revenues The value of having another dollar in the government’s hands relative to its next best use in the private sector.
20.2 Optimal Commodity Taxation Inverse Elasticity Rule If we assume that the supply side of commodity markets is perfectly competitive (elasticity of supply is infinite), then the Ramsey result implies that This formulation of Ramsey’s rule shows that two factors must be balanced when setting optimal commodity taxes: • The elasticity rule:When elasticity of demand for a good is high, it should be taxed at a low rate; when elasticity is low, the tax rate should be high. • The broad base rule:It is better to tax a wide variety of goods at a moderate rate than to tax very few goods at a high rate. Because the marginal deadweight loss from a tax rises with the tax rate, the government should spread taxes across a large number of commodities and not tax any one commodity at a very high rate.
20.2 Optimal Commodity Taxation Equity Implications of the Ramsey Model Imagine that the government had only two goods it could tax, cereal and caviar: • The elasticity of demand for caviar is much higher than that for cereal, so the inverse elasticity rule would suggest that the government tax cereal much more highly than caviar. • This would mean imposing a tax on a good consumed exclusively by higher-income groups that was much lower than the tax imposed on a good consumed by all. This outcome, while efficient, might violate a government’s sense of tax fairness across income groups (vertical equity).
APPLICATION 20.2 Optimal Commodity Taxation Price Reform in Pakistan Angus Deaton (1997) studied the demands for commodities in several developing nations. He used variation in prices encountered by consumers of rice, wheat, and other commodities to estimate their elasticities of demand.
20.2 Optimal Commodity Taxation Efficiency Consequences of Subsidies and Taxes in Pakistan •In panel (a), the market for wheat,demand is fairly inelastic and supply is subsidized, leading quantity to increase from Q1 to Q2 with a deadweight loss of BAC. In panel (b), the market for rice, demand is very elastic, so when supply is subsidized the quantity rises by much more (from Q1 to Q2), and the deadweight loss is larger (BAC). In panel (c), the market for oils and fats, demand is also very elastic, so even the small tax leads to a large reduction in quantity from Q1 to Q2, with a deadweight loss of BAC.
20.3 Optimal Income Taxes optimal income taxation Choosing the tax rates across income groups to maximize social welfare subject to a government revenue requirement.
20.3 Optimal Income Taxes General Model with Behavioral Effects
20.3 Optimal Income Taxes General Model with Behavioral Effects The optimal income tax system meets the following condition: Where MU is the marginal utility of individual i, MR is the marginal revenue raised from taxing that individual, is the value of additional government revenues. In the case of income taxation, the optimal tax system reflects a different balancing: • Vertical Equity:Social welfare is maximized when those who have a high level of consumption, and thus a low marginal utility, are taxed more heavily, and those who have a low level of consumption, and thus a high marginal utility, are taxed less heavily. • Behavioral Responses:As taxes rise on any one group, individuals in that group may respond by earning less income.
20.3 Optimal Income Taxes An Example
20.4 Tax-Benefit Linkages and the Financing of Social Insurance Programs tax-benefit linkages Direct ties between taxes paid and benefits received.
20.4 Tax-Benefit Linkages and the Financing of Social Insurance Programs The Model
20.4 Tax-Benefit Linkages and the Financing of Social Insurance Programs Issues Raised by Tax-Benefit Linkage Analysis If There Is No Inefficiency to Providing a Benefit, Why Doesn’t the Employer Just Do So Without Government Involvement?
20.4 Tax-Benefit Linkages and the Financing of Social Insurance Programs Issues Raised by Tax-Benefit Linkage Analysis When Are There Tax-Benefit Linkages? The tax-benefit linkage is strongest when taxes paid are linked directly to a benefit for workers. What Is the Empirical Evidence on Tax-Benefit Linkages? The existing literature suggests that the cost of social insurance financing is borne by workers in the form of lower wages and not lower employment.
20.5 Conclusion • The fundamental issue in designing tax policy is the equity-efficiency trade-off. • Understanding tax efficiency really comes down to remembering two key principles: • The more elastically supplied or demanded the good, the larger the deadweight loss from the tax. • The higher the tax rate, the larger the incremental deadweight loss of taxation. • Trading off these two considerations is the key to understanding the efficiency aspects of the tax policies.
Example of Incidence Effects of a Tax(Ch. 19) A $2 tax is imposed on the sale of bikes at the store Qd=200-10P Qs= -10+20P Who bears the statutory incidence of the tax? Who bears the economic incidence of the tax? Illustrate the old and new equilibrium Find the price and quantities What is the share of the incidence borne by consumers and producers?