Download
1 / 52
530 likes | 644 Views
Introduction. Analysis and Visualization of Knowledge Domains Draws on Research in Information Retrieval Data Analysis/Data Mining/ Knowledge Discovery Bibliometrics/Scientometrics/Webometrics Information Visualization & Interaction Design <-> Visual Perception, Human-Computer Interaction

E N D
Introduction Analysis and Visualization of Knowledge Domains Draws on Research in • Information Retrieval • Data Analysis/Data Mining/Knowledge Discovery • Bibliometrics/Scientometrics/Webometrics • Information Visualization & Interaction Design <-> Visual Perception, Human-Computer Interaction • Philosophy of Science (for interpretation) • Knowledge Elicitation (for evaluation) My main research area is Information Visualization and more recently the Visualization of Knowledge Domains.
Analysis and Visualization of Knowledge Domains • Requires large amounts of, e.g., publication, patent, and grant data and advanced analysis and visualization techniques. • Can be utilized to objectively identify major research areas, experts, institutions, grants, publications, journals, etc.; to identify interconnections, the import and export of research between fields, the dynamics (speed of growth, diversification) of scientific fields, scientific and social networks, and the impact of strategic and applied research funding programs, among others.
Knowledge Domain Visualizations in Education [4.75] Provide an overview of the knowledge domain areas covered in the course (road map). [4.25] Show the interrelationship of the course topic to other related knowledge domains. [3.25] Identify major experts and their fields of expertise. [ 3.5 ] Identify major publications, what they cite, and who cites them. [4.25] Show the influence of one theory on subsequent work. [3.75] Show the evolution of the knowledge domain (based on publications) over the last, say 10 years. [ 4.0 ] Show research frontiers (e.g., based on areas containing young but highly cited papers). [ 4.5 ] Find research related to a certain topic, e.g., learning. [3.75] Identify material to be covered in a talk, course, textbook, Encyclopedia, etc.
Domain Visualizations are Facilitated by • The explosion of information available digitally. • Decreasing cost of storage and computing power. • Larger hard disk sizes easing fast access to data. • Fast graphics processors. • High resolution color monitors. • Expanding connectivity between systems. • The mismatch between computer displays and the human perceptual system. • The mismatch between computer controls and human motor functions.
Sample Applications • "Science of science" - to study science with scientific means (Price 1965). • Synthesis of specialty narratives from co-citation clusters (Small, 1986). • Detect advances of scientific knowledge via "longitudinal mapping" (Garfield, 1994). • Knowledge discovery in un-connected literature (Swanson & Smalheiser, 1997). • Identify cross-disciplinary fertilization via "passages through science" (Small, 1999, 2000). • Understand scholarly information foraging (Sandstrom, 2001).
Determine areas of expertise for specific researcher, research group via "invisible colleges" (note that researchers self definition might differ from how field defines him/her) (Crane, 1972). • Identify profiles of authors, also called CAMEOS, to be used to for document retrieval or to map an author’s subject matter and studying his/her publishing career, or to map the social and intellectual networks evident in citations to and from authors and in co-authorships (White, 2001). • Learn how to write highly cited papers (van Dalen & Henkens, 2001).
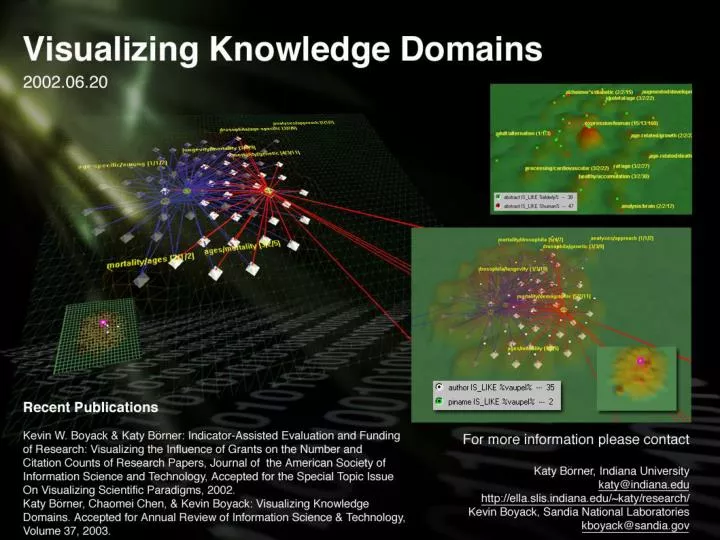
Identification of scientific frontiers http://www.science-frontiers.com/. • ISI's Essential Science Indicatorshttp://essentialscience.com/ • Import-export studies (Stigler, 1994). • Evaluation of 'big science' facilities using 'converging partial indicators' (Martin, 1996; Martin & Irvine, 1983). • Input (levels of funding, expertise of scientists, facilities used) - output (publications, patents, Nobel prices, improved health, reduced environment insults, etc. - influenced by political, economic, financial, and legal factors studies (Kostroff & DelRio, 2001). • Determine influence of funding on research output (Boyack & Borner, 2002).
Visualizing Knowledge Domains The content and figures in this part were taken from: Katy Börner, Chaomei Chen, & Kevin Boyack (2003) Visualizing Knowledge Domains. In Blaise Cronin (Editor). Annual Review of Information Science and Technology. Volume 37. Medford, NJ: Information Today, Inc./American Society for Information Science and Technology. Pp. 179-255. (published November, 2002). Color versions of many images can be found at http://www.asis.org/Publications/ARIST/Vol37/BornerFigures.html
The paper aims (1) To give a literature review of research on 'visualizing knowledge domains' by applying knowledge domain visualization techniques to analyze and visualize this domain. (2) To provide a tutorial on how to design visualizations of knowledge domains. Unique feature: Utilizes ARIST data set to compare different approaches.
SEARCH TERM USED Number of matching articles Topic Citation Analysis: citation analysis 596 cocitation OR co-citation 177 co-occurrence AND (term OR word) 77 co-term OR co-word 52 science map[ping] OR mapping science OR map[ping] of science 32 Topic Semantics: semantic analysis OR semantic index OR semantic map 331 Topic Bibliometrics: bibliometric 818 scientometric 327 Topic Visualization: data visualization OR visualization of data 275 information visualization OR visualization of information 113 scientific visualization 268 The ARIST Data Set Retrieved from Science Citation Index (SCI) and Social Science Citation Index (SSCI). The 2764 unique articles match citation analysis, semantics, bibliometrics, visualization related terms in titles, abstracts, and terms for the years 1977-July 27, 2001.
Numbers of articles in the ARIST data set by year with terms (ISI keywords) or abstracts.
Number of articles by journal in the ARIST set (10 or more articles per journal)
Citation counts dropped throughout the 90s. Most recent articles are cited infrequently due to their young age. Figure shows dramatic increase in publishing in citation analysis and bibliometrics starting in the late 80s and the birth of IV around the same time.
The Importance of Good Data It is extremely important to choose an appropriate data source for retrieval, one whose data are likely to provide answers to the questions one wishes to answer using domain visualization. • Limitations of the ARIST Data Set • No abstracts or terms prior to 1991. • Terms are available for only 71%. Abstracts are available • for 81% of the articles published since 1991. • Limited book, journal, conference coverage. No patents, • policy changes, media coverage, Nobel prices, quality of • graduate programs, …
Structure of Knowledge Domain Visualization Research (based on the ARIST data set) Three different kinds of visualizations: • GSA/StarWalker use Principal Component Analysis to break down domain into components. • ET-Maps and Cartographic Self Organizing Maps display overall domain structure as adjacent regions. • VxInsight uses a modified Force Directed Placement algorithm named VxOrd to display a ‘data landscape’. The different visualizations provide different views of the domain and enable a comparison of algorithms.
(1) GSA/StarWalker • Author co-citation analysis • Document co-citation analysis Procedure: • Select a set of highly cited authors/documents (at least 10 citations). • Compute co-citation frequencies. • Apply Pathfinder Network Scaling to determine interconnectivity structure. • Apply factor analysis to define intellectual groupings (e.g. mappingscience, social studies of science, bibliometrics) • Determine and display citation impact factor atop the intellectual groupings.
The Author Co-citation Map (1977-2001) consists of 380 authors with 9 or more citations. The map is dominated by the largest specialty of citation indexing. No strong concentration of other specialties are found, which implies the diversity of the domain. Color code: red - mapping science green – social studies of science Blue – bibliometrics The three factors cummulatively explain 63% of the variance
Landscape View of Author Co-citation Map The height of a citation bar indicates the number of citations for the correspondent author. The spectrum of colors on each citation shows the time when citations were made. Authors with more than 50 citations are displayed with semi-transparent labels.
The Document Co-citation Analysis Map The height of a bar represents the number of citations to a publication. Labels indicate articles in clusters, for example, Small73 for an article of Small in 1973. Multiple publications within the same year are not distinguished at this level. For example, Small73 includes all Small’s publications in 1973.
The Document Co-citation Analysis Map Top-down view. Hand labeling of major clusters. Color code: red - mapping science green – social studies of science Blue – bibliometrics
(2a) ET Map of ARIST Data Set by Bin Zhu and Hsinchun Chen, U Arizona • Trained 10x 10 nodes using ID/keyword data of the ARIST data set. • After training, each node is associated with a list of documents that are semantically similar to each other. • Each document list is labeled by the most frequently occurring keyword • Spatial proximity on the map indicates semantic proximity.
The size of the subject area is not necessarily related to the number of documents in an ET-map, but rather denotes the amount of space between areas based on the number of nodes used to generate the map.
(2b) SOM Map of ARIST Data by Andre Skupin, U New Orleans • SOM are used to generate domain visualizations in cartographic fashion. • 40 x 55 node SOM was trained based on ID/keyword list of ARIST data set. • ArcGIS is used to generate the visualization. • Dominance of clusters corresponds to number of articles it contains. Higher elevation—i.e., percentage—indicates a very organized, focused, and coherent portion of the information space. • Labels are automatically assigned based on highly frequent keywords and are drawn within ArcGIS.
(3) VxInsight, Sandia National Labs Next slides show: • VxInsight citation maps of ARIST data for four different time segments. • VxInsight co-term and LSA maps of ARIST data. • VxInsight co-classification map of ARIST data. • Comparison of maps. Dot color legend WHITE: citation analysis, GREEN: bibliometrics, BLUE: semantics, MAGENTA: visualization.
1. VxInsight citation maps of ARIST data for four different time segments. A citation-based map using direct and co-citation linkages after the combined linkage method of Small (1997) using a direct:cocitation weighting factor of 20:1. Shows growth of different areas Dot color legend WHITE: citation analysis, GREEN: bibliometrics, BLUE: semantics, MAGENTA: visualization.
A: bibliometrics B: visualization C: semantic analysis D: citation analysis, bibliometrics, visualization are mixed
2. VxInsight co-term and LSA maps of ARIST data Co-term map is based on a cosine similarity using ISI keywords. LSA was applied over title words to generate a document-by-document similarity matrix. Only similarity values > 0.9 were used in VxOrd FDP to generate the map. Dot color legend WHITE: citation analysis, GREEN: bibliometrics, BLUE: semantics, MAGENTA: visualization.
3. VxInsight co-classification map of ARIST data based a cosine similarity from the ISI journal classifications for each article. Dot color legend WHITE: citation analysis, GREEN: bibliometrics, BLUE: semantics, MAGENTA: visualization.
4. VxInsight: Comparison of Maps Dot color legend WHITE: citation analysis GREEN: bibliometrics, BLUE: semantics MAGENTA: visualization. A: Cartographic-SOM B: ET-Map C: Co-term D: LSA
Obvious visual differences between layouts. SOMs tend to fill space more uniformly. Citation analysis (yellow) and bibliometrics (green) are always found together. Visualization (magenta) and semantics (blue) are mostly by themselves.
Strong co-term linkages based on cosine similarity for the three term-based document maps.
Conclusions • Research on KDVs grows out of semantic analysis/indexing/mapping, citation analysis, bibliometrics, and visualization. • There is interaction between the groups of researchers and their literature in citation analysis and bibliometrics. Visualization and semantics are mostly by themselves. • KDVs could be beneficially used by diverse user groups and in diverse information seeking tasks but their design and usage is limited due to • Availability of data and scalable code. • Required processing power. • Complexity/Usability of today's KDVs. Research Collaboration: TOPIC model by Griffiths and Steyvers is incremental, scalable, & generative. It produces good labels and can hopefully be applied recursively to generate maps of different resolutions.
Acknowledgements We greatly appreciate the time and effort Bin Zhu, Hsinchun Chen, and André Skupin put into the generation, discussion and comparison of the ET-Map and Cartographic SOM map. We wish to thank Katherine W. McCain, Blaise Cronin, Ralf Shaw, Henry Small, and Pamela Sandstrom for her very insightful comments. Ben Shneiderman and Alan Porter commented on an earlier version of the ARIST chapter. We gratefully acknowledge support for this work by The Council for Museums Archives and Libraries in the UK (RE/089), Laboratory Directed Research and Development, Sandia National Laboratories, U.S. Department of Energy (DE-AC04-94AL85000), and an NIH/NIA demonstration fund for Mapping Aging Research.
Challenges and Opportunities Top Ten List of Challenges (adopted from Chen 2002) • Domain Specific vs. Domain Independent - how much domain knowledge is needed to do the analysis? • Quality vs. Timeliness - quality comes from collective expert views expressed in quickly outdated publications. • Interdisciplinary Nature - many areas contribute to the analysis, visualization and interpretation of KDVs. • Validation - understanding the strength and weaknesses of different techniques. • Design Metaphor - what metaphors are most effective? • Coverage - expand citation indexing databases to cover proceedings, technical reports, etc.
Scale-up - algorithmically, but also in terms of design & validation. • Automatic Labeling - requires proper classification & categorization. • Individual Differences • Ethical Constraints - KDVs enable to understand scientific networks, the influence of scholars, etc. hence to quickly gain the knowledge that distinguishes an expert from a newcomer.
In Work: IV/IR Computing Infrastructure at IU • 1TB data space connected to parallel computing facilities running diverse data analysis, retrieval, and visualization services. • Online data, computing and services access for researchers, educators, and society. • Will facilitate sharing of code and (derivative) data & the generation of IVs/KDVs from large scale data sets.
About 4,500,000 documents (books, journals, proceedings, doctoral and masters theses, technical reports, patents, grants) covering cross-disciplinary research as well as domain specific documents from Computer Science, Physics, Mathematics, and Medicine.
Opportunities Knowledge domain visualizations can • Become a valuable tool for scientists, philosophers of science, sociologists of knowledge, librarians, government agencies, others to grasp crucial developments in science and technology. • Help discover topical relationships, research trends, complementary capabilities thereby facilitating research. • Help translate among disciplines, bridge the gap between mutually unintelligible jargons. • Study science using the scientific methods of science as suggested by Derek J. deSolla Price.
Related Conferences, Symposia, … • International Symposium on Knowledge Domain Visualization IV02-KDViz at IV 2003, London UK, July 16-18, 2003. http://www.graphicslink. demon.co.uk/IV02/KDViz.htm • International Conference on Scientometrics and Informetrics, Beijing, P.R. of China, 2003. http://www.cscd.ac.cn/issi2003/ • Sackler Colloquium on Mapping Knowledge Domains, NAS' Beckman Center, Irvine, CA, May 9-11, 2003. http://vw.indiana.edu/sackler03
Common Database • A major goal of the colloquium is to demonstrate and compare different techniques, algorithms, and approaches that can be utilized to map knowledge domains. • Registered participants are eligible to utilize the so called PNAS Data Set. The data set comprises full text documents from the Proceedings of the National Academy of Sciences covering 01-07-1997 to 09-17-2002 (148 issues containing some 93,000 journal pages). Paper Submission • 2-page abstract by March 1st, 2003. • Student packages are available (registration fee plus $500 support).