Download
1 / 52
520 likes | 522 Views
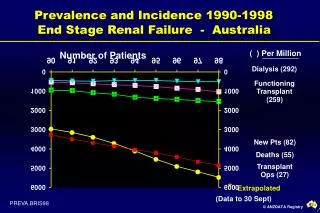
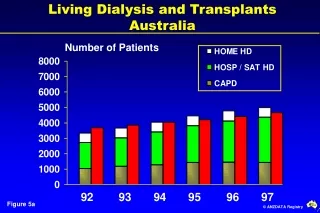
This report provides data on the number of transplant operations, functioning transplants, and patient survival rates in Australia and New Zealand from 1990 to 1998. It also includes information on transplant rates, recipients per million population, and graft survival rates.

E N D
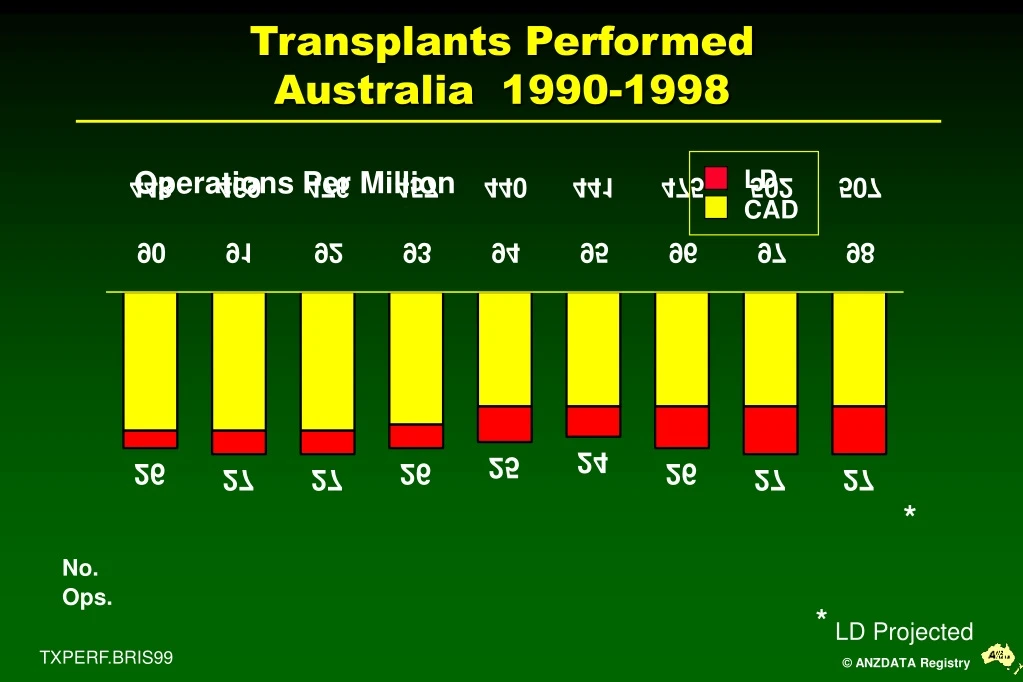
LD CAD Transplants PerformedAustralia 1990-1998 Operations Per Million * No. Ops. * LD Projected TXPERF.BRIS99
LD CAD Transplants PerformedNew Zealand 1990-1998 Operations Per Million * No. Ops. * LD Projected TXPERFZ.BRIS99
Transplant Operations (Per Million)1-Oct-97 to 30-Sep-98 Australia 27 (n=513) New Zealand 29 (n=110) No. Ops. 99 156 118 14 67 15 44 TXPTS.BRIS99
Functioning Transplants (Per Million) Caring State 30-Sep-98 Australia 257 (n=4820) New Zealand 237 (n=900) No. Pats. 974 1624 1157 106 506 51 220 CARETX.BRIS99
Rate of Transplant Operations (Per Million)By Year (1-Oct to 30 Sep)
Rate of Transplant Operations (Per Million)By Year (1-Oct to 30 Sep)
Transplant Rate (Per Million Population)By Year (1 Oct to 30 Sep) Australian Recipients Per Million TXRECAU-BRIS99
Transplant Rate (Per Million Population)By Year (1 Oct to 30 Sep) New Zealand Recipients Per Million TXRECNZ-BRIS99
Transplant Rate (Per Million Population) By Year (1 Oct to 30 Sep) Queensland Recipients Per Million TXQLD-BRIS99
Transplant Rate (Per Million Population) By Year (1 Oct to 30 Sep) New South Wales Recipients Per Million TXNSW-BRIS99
Transplant Rate (Per Million Population) By Year (1 Oct to 30 Sep) Victorian Recipients Per Million TXVIC-BRIS99
Transplant Rate (Per Million Population) By Year (1 Oct to 30 Sep) Tasmanian Recipients Per Million TXTAS-BRIS99
Transplant Rate (Per Million Population) By Year (1 Oct to 30 Sep) South Australian Recipients Per Million TXSA-BRIS99
Transplant Rate (Per Million Population) By Year (1 Oct to 30 Sep) Northern Territory Recipients Per Million TXNT-BRIS99
Transplant Rate (Per Million Population) By Year (1 Oct to 30 Sep) Western Australian Recipients Per Million TXWA-BRIS99
Primary Cadaver Patient Survival 1990-1996 Related to Year of Transplant Australia Patient Survival
Primary Cadaver Graft Survival 1990-1996 Related to Year of Transplant Australia Graft Survival
Primary Cadaver Patient Survival 1990-1996 Related to Year of Transplant New Zealand Patient Survival
Primary Cadaver Graft Survival 1990-1996 Related to Year of Transplant New Zealand Graft Survival
Second and Subsequent Cadaver Patient Survival Related to Years of Transplant 1983-1997 Patient Survival Australia Years
Second and Subsequent Cadaver Graft Survival Related to Years of Transplant 1983-1997 Graft Survival Australia Years
Primary Cadaver Graft Survival 1989-1997 According to Peak Sensitization (Death Censored) Australia % Peak PRA <20 v 20-49 p = 0.36 <20 v 50-79 p = 0.05 <20 v 80 p = 0.0001 20-49 v 50-79 p = 0.027 20-49 v 80 p = 0.0002 50-79 v 80 p = 0.155 SENS1.98
Primary Cadaver Graft Survival 1989-1997 According to Sensitization at Transplantation(Death Censored) Australia % PRA <20 v 20-49 p = 0.784 <20 v 50 p = 0.009 20-49 v 50 p = 0.037 SENS2.98
Primary Cadaver Graft Survival 1989-1997 According to Sensitization: Peak and Time ofTransplantation (Patient Death Censored) Australia % PRA P<20 C<20 v P50 C <20 p = 0.0034 P<20 C<20 v P50 C 50 p = 0.0057 P50 C<20 v P50 C 50 p = 0.4954 SENS3.98
Subsequent Graft Survival 1989-1997 According to Peak Sensitization (Death Censored) Australia % Peak PRA 20-49 v 50-79 p=0.1054 20-49 v 80 p=0.0067 50-79 v 80 p=0.3077 <20 v 20-49 p=0.5928 <20 v 50-79 p=0.0220 <20 v 80 p=0.0004 SENS4.98
Subsequent Graft Survival 1989-1997 According to Sensitization at Transplantation(Death Censored) Australia % PRA <20 v 20-49 p = 0.006 <20 v 50 p = 0.002 20-49 v 50 p = 0.775 SENS5.98
Subsequent Graft Survival 1989-1997 According to Sensitization: Peak and Time ofTransplantation (Patient Death Censored) Australia % PRA P<20 C<20 v P50 C <20 p = 0.0603 P<20 C<20 v P50 C 50 p = 0.0008 P50 C<20 v P50 C 50 p = 0.2071 SENS6.98
Primary Cadaver Graft SurvivalSensitized Recipients: Year of Transplantation1989-91 1992-94 1995-97 Australia Peak PRA 50% Years 1989-91 v 1992-94 p = 0.770 1989-91 v 1995-97 p = 0.045 1992-94 v 1995-97 p = 0.133 SENS7.98
Subsequent Cadaver Graft Survival Sensitized Recipients: Year of Transplantation1989-91 1992-94 1995-97 Australia Peak PRA 50% Years 1989-91 v 1992-94 p = 0.463 1989-91 v 1995-97 p = 0.407 1992-94 v 1995-97 p = 0.912 SENS8.98
Primary Cadaver Graft Survival 1989-1997Sensitized Recipients (Peak PRA 50%)According to HLA AB and DR Mismatch Australia AB and DR Mismatch p = 0.032 SENS11.98
Subsequent Graft Survival 1989-1997Sensitized Recipients (Peak PRA 50%)According to HLA AB and DR Mismatch Australia AB and DR Mismatch p = 0.013 SENS14.98
Cadaver Grafts - Australia1-Apr-97 to 30-Sep-98 Rejection Episodes in First 30 Days REJ1.BRIS99
Cadaver Grafts - Australia1-Apr-97 to 30-Sep-98 Rejection Episodes in First 30 Days REJ2.BRIS99
Cadaver Grafts - Australia1-Apr-97 to 30-Sep-98 Vascular Rejection in Biopsy Proven Rejection in First 30 Days REJ3.BRIS99
Cadaver Grafts - Australia1-Apr-97 to 30-Sep-98 Glomerular Rejection in Biopsy Proven Rejection in First 30 Days REJ4BRIS99
Primary Cadaver Grafts - Australia1-Apr-97 to 30-Sep-98 Rejection Episodes in First 30 Days According to Peak Sensitization REJ5.BRIS99
Subsequent Cadaver Grafts - Australia1-Apr-97 to 30-Sep-98 Rejection Episodes in First 30 Days According to Peak Sensitization REJ6.BRIS99
Primary Cadaver Grafts - Australia1-Apr-97 to 30-Sep-98 Vascular Rejection in Episodes in First 30 Days According to Peak Sensitization REJ7.BRIS99
Subsequent Cadaver Grafts - Australia1-Apr-97 to 30-Sep-98 Vascular Rejection in Episodes in First 30 Days According to Peak Sensitization REJ8.BRIS99
Primary Cadaver Grafts - Australia1-Apr-97 to 30-Sep-98 Glomerular Rejection in Episodes in First 30 Days According to Peak Sensitization REJ9.BRIS99
Subsequent Cadaver Grafts - Australia1-Apr-97 to 30-Sep-98 Glomerular Rejection in Episodes in First 30 Days According to Peak Sensitization REJ10.BRIS99
Primary Cadaver Grafts 1-Apr-97 to 30-Sep-98Any Rejection in First 30 DaysAccording to Recipient Age Rejection (No Biopsy) Australia Rejection (Biopsy Proven) No Rejection 0-29 30-49 50 Recipient Age REJAGE.BRIS99
Primary Cadaver Grafts - Australia1-Apr-97 to 30-Sep-98 Number of Rejection Episodes in First 90 Days According to Age of Recipient REJ11.BRIS99
Primary Cadaver Grafts 1-Apr-97 to 30-Sep-98Any Rejection in First 90 DaysAccording to Centre Rejection (No Biopsy) Australia Rejection (Biopsy Proven) No Rejection A B C D E F Centre REJCENT.BRIS99
Primary Cadaver Grafts - Australia1-Jan-93 to 30-Sep-98 Initial Immunosuppressive Treatment REJ14.BRIS99
Primary Cadaver Grafts - Australia1-Apr-97 to 31-Mar-98 Rejection Occurring in the First 30 Days According to Initial Immunosuppression REJ12.BRIS99
Primary Cadaver Grafts - Australia1-Apr-97 to 31-Mar-98 Antibody Treatment for Rejection in First 30 Days According to Initial Immunosuppression REJ13.BRIS99
Primary Cadaver Grafts Australia 1993-1997 Serum Creatinine at Three and Six Months (Mean and 95% Confidence Interval) According to Initial Immunosuppression REJ15.BRIS99
Primary Cadaver Grafts - Australia 1-Apr-97 to 30-Sep-98 Rejection Episodes in First 90 Days According to Initial Immunosuppression REJ17.BRIS99
Primary Cadaver Grafts - Australia 1-Apr-97 to 30-Sep-98 Rejection in Episodes in First 90 Days According to Initial Immunosuppression REJ19.BRIS99