Download
1 / 10
100 likes | 303 Views
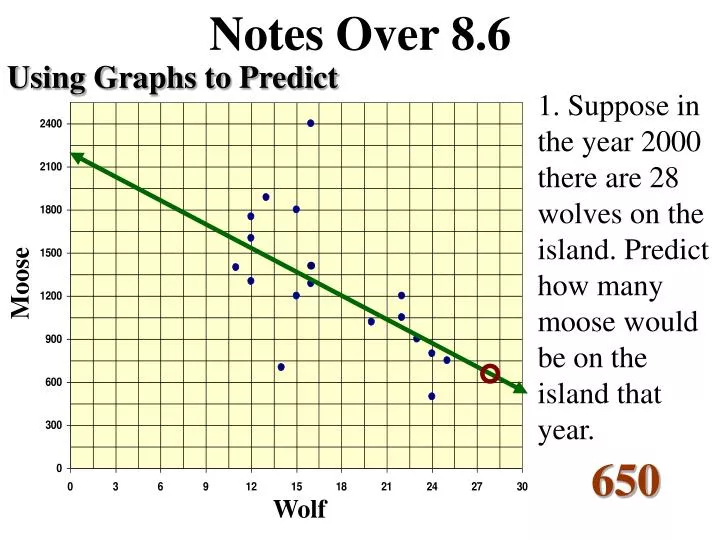
Notes Over 8.6. Using Graphs to Predict. 1. Suppose in the year 2000 there are 28 wolves on the island. Predict how many moose would be on the island that year. Moose. 650. Wolf. Notes Over 8.6. Using Graphs to Predict.

E N D
Notes Over 8.6 Using Graphs to Predict 1. Suppose in the year 2000 there are 28 wolves on the island. Predict how many moose would be on the island that year. Moose 650 Wolf
Notes Over 8.6 Using Graphs to Predict 2. Suppose in the year 2003 there are 16 wolves on the island. Predict how many moose would be on the island that year. Moose 1300 Wolf
Notes Over 8.6 Using Graphs to Predict 3. Why is there such a difference among 1987, 1995, and 2003? Moose 16 – 1380 16 – 2400 16 – 1300 Trend line is an estimate, not exact. Wolf
Pg 418 8 – 6 #1 – 2, 3 – 15 The table shows the population of some states and the numbers of cars registered in those states. Use the data for Exercise 1 and 2.
Pg 418 8 – 6 #1 – 2, 3 – 15 1. Make a scatter plot of the data. Use the population for the horizontal axis. 12 10 8 6 4 2 0 0 4 8 12 16 20 24
Pg 418 8 – 6 #1 – 2, 3 – 15 b. Draw a trend line. 12 10 8 6 4 2 0 0 4 8 12 16 20 24
Pg 418 8 – 6 #1 – 2, 3 – 15 c. Predict how many cars are registered by the 7.3 million people in North Carolina. 3.6 million 12 10 8 6 4 2 0 0 4 8 12 16 20 24
Pg 418 8 – 6 #1 – 2, 3 – 15 d. Write an equation for your trend line. m = ½ b = 0 12 10 8 6 4 2 0 Predict how many cars are registered by the 32.2 million people in California. 16.1 million 0 4 8 12 16 20 24
Pg 418 8 – 6 #1 – 2, 3 – 15 2. Describe the correlation between the two sets of data. Positive Correlation 12 10 8 6 4 2 0 0 4 8 12 16 20 24