Download

1 / 38
380 likes | 404 Views
Explore the complexity of subjective well-being (SWB) through an in-depth analysis of international differences in well-being. This study challenges the notion that happiness is a singular variable by proposing a multi-dimensional perspective, separating life judgments and momentary feelings. Discover the intercorrelation of well-being measures and predictors influencing SWB. Explore the impact of income, possessions, time spent, and conveniences on life satisfaction, happiness, and affect balance. Analyze the asymmetry in SWB changes in response to income fluctuations and the implications of Easterlin's paradox on well-being assessments. Gain insights into the nuanced relationship between income and various components of well-being, shedding light on the complexity of measuring happiness globally.

E N D
Subjective Well-Being is Not Unitary Ed Diener Daniel Kahneman Raksha Arora William Tov International Differences in Well-Being Princeton, 2008
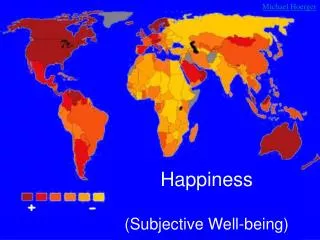
SWB or WBIs Not one thing • Which are the happiest nations? • Does money influence happiness? • What are the causes of happiness? Such questions assume there is one variable in “happiness”
BUT • Empirically – no • Diener, Lucas, etc. Life satisfaction, positive affect, etc. are separate • Conceptually • Kahnamen – judgment vs. momentary feelings are separate
Let’s take seriously the idea that “happiness” is more than one thing
We Propose a Dimension Global life judgments, reflective V • Life satisfaction • Reports of happiness V Momentary affect, feelings at the moment
Intercorrelation of Well-Being Measures Well-Being Life VariablesLadderSatisfactionHappiness Life Satisfaction .74 Happiness .62 .71 Affect Balance .53 .56 .71
Intercorrelation of Well-Being Measures Well-Being Life VariablesLadderSatisfactionHappiness Life Satisfaction .74 V Happiness .62 < .71 V V Affect Balance .53 < .56 < .71
Predicting Life Satisfaction Ladder Score Beta = .61 (p < .01) Affect Balance Beta = .28 (p < .01) • Predicting Happiness Ladder Score Beta = .23 (NS) Affect Balance Beta = .54 (p < .01)
Indicates the Ordering: Judgment-------------------------------------Feelings Ladder Life Satisfaction Happiness AffectBalance
Distributions Also Support a Distinction: Feelings versus Judgment different Cacioppo – “Positivity offset” Diener and Diener “Most people are happy” – but happy how?
Life Judgments Are Dramatically Less Positive than Affect • Biological? • Therefore more room to move?
Predictors Correlated with Four Measures of Well-Being Well-Being Income Per Choose How to Possession of CapitaSpend TimeConveniences Ladder Score .83 a .33 a .80 a Life Satisfaction .58 b .51 b .46 b Happiness .34 bc .54 b .16 bc Affect Balance .31 c .57 b .16 c
Judgment ------------------------------------- Feelings Ladder Life Satisfaction Happiness Affect Balance Income Psychological Conveniences Needs??? Prosperity e.g. Autonomy Positive
Easterlin Paradox:What About Changes in Income? Are changes in national income more associated with judgments than with feelings?
Two Waves of Data for Each SWB Variable Criterion – two surveys using same instrument more than five years apart Years Apart Ladder 36 Life Satisfaction 21 Happiness 20
Per Capita Income LadderLife Sat.Happiness Wave 1 PPP $ 8,148 $ 10,702 $ 11,187 Wave 2 PPP $ 19,938 $ 22,114 $ 20,332 Log10 Change .39 .33 .26
Well-Being LadderLife Sat.Happiness Wave 1 5.58 6.68 3.01 Wave 2 6.31 6.91 3.08 Difference: +.72 +.23 +.07 p < .01 .05 .10
Size of Mean Well-being Changes LadderLife Sat.Happiness Percentage of scale change 7 2 2 Between-nation .70 .23 .25 SD units
Correlations of Changes with Income Ladder r = .56, p < .05 Life satisfaction r = .33, p < .10 Happiness r = .24, NS
Change Regression Analyses: Over time predictions (Betas): Log income T1 SWBChange Ladder .85 .37 (p < .06) Life satisfaction .83 .26 (p < .01) Happiness .58 .22 (p < .10)
Box Score AnalysesAcross 3 SWB Measures: SWB Change Income ChangeDownUp Down 7 1 Up 25 65
Thus: • Asymmetry • When income down, SWB down 88 % • When income up, SWB up 72 %
Happiness Change GDP Up versus Down • Absolute change in Happiness • GDP up -- .16 scale score change • GDP down -- .37 scale score change p < .01
Conclusions • Types of SWB are not the same things • They can be ordered on the dimension from judgment to feelings • Judgments reflect income more • For the Ladder there appears to have been little scale recalibration • Feelings of SWB have changed less over time in response to income • Downward income change more powerful than upward income change
Easterlin’s Paradox? • Judgments more likely to change in response to changing income, although they do not invariably do so • Happiness is less related to income, and has been less responsive to income changes
Predictors Correlated with Four Measures of Well-Being Well-Being Income Per Choose How to Possession of Variables Capita Spend Time Conveniences • Affect Balance .31c .57a .16a • Ladder Score • Time 1 .82b • Time 2 .83d .33b .80c • Life Satisfaction • Time 1 .66a • Time 2 .58e .51a .46b • Happiness • Time 1 .35a • Time 2 .34ce .54a .16ab
Raw vs. Log Income • Ladder change and income change: • Log income r = .56, p < .05 • Raw income r = .16, NS Listwise N = 18
Income Up • Life Satisfaction down in 39 percent of nations when income rose • Happiness down 22 % when income up • Ladder down 22 % when income up