Download
1 / 52
520 likes | 643 Views
Drivers of Portfolio Performance . Presented by: Barbara Boswell Finance Director City of Lancaster David Witthohn, CFA, CIPM Director Cutwater Asset Management. California Society of Municipal Finance Officers (CSMFO). February 21, 2013. Cash Flow Forecasting.

E N D
Drivers of Portfolio Performance • Presented by: Barbara Boswell Finance Director City of Lancaster David Witthohn, CFA, CIPM Director Cutwater Asset Management • California Society of Municipal Finance Officers (CSMFO) • February 21, 2013
Last saved: Thursday, July 19, 2012 at 7:29 PM Cash Flow Forecasting
Do you really need most of your funds within the next 24 hours? Maturity Distribution – to final
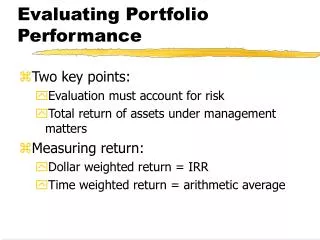
Target Duration: Risk/Return Tradeoff • Normally, the yield curve provides higher returns for longer maturities, but these incremental increases are much smaller for securities that are more than 10 years to maturity. Source: Bloomberg
What is a Cash Flow Forecast? • Projection of anticipated receipts • Projection of anticipated disbursements • Estimate of investable cash balances • Liquid funds • Core funds
Why Prepare a Cash Flow Forecast? • Improves investment earnings • Ensures liquidity for disbursements • Identifies short-term cash deficits • Warns of impending budget problems
Major Impediments to Forecasting • Tendency to think in budget years • Difficulty distinguishing between fund balance and cash balance • Inadequate time and/or staff • Unpredictability of revenues and expenditures • Lack of information and communication • Lack of adequate technology
Types of Cash Forecasts • Annual Forecasts • Estimates monthly cash position • Determines cash available for investments • Provides a useful monthly overview for investment decision-making • Prepared for this fiscal year and next one- to two-fiscal years
Types of Cash Forecasts • Project-based Forecasts • Provides monthly data on status of capital projects • Helps fine tune monthly and weekly forecasts • May require input from contractors or in-house project managers
Tools for Cash Flow Forecasting • Historical data from general ledger • Historical data from bank statements • Current year budget • Capital project spending projections • Other major departments’ budgets • Schedule of investment maturities and coupon payments
Major revenue types Property tax Sales and use tax User fees Federal and state assistance Grants Bond proceeds Other Major expenditure types Payroll (net) Withholding and benefits Debt service Capital expenditures Materials and supplies Overhead (e.g., utilities) Other Identify Revenues and Expenditures
Forecasting Receipts • Identify 4-5 categories for major sources of revenue • Compile historical data of actual monthly receipts • Identify significant changes • Identify non-recurring items from prior years and for coming year • Develop analysis of monthly receipts as a percent of annual • Adjust historical distribution for known differences
Forecasting Disbursements • Establish reasonable number of categories • Compile historical data of actual monthly disbursements • Identify significant changes • Identify non-recurring items from prior years and for coming year • Develop analysis of recurring monthly disbursements as a percent of annual • Include debt service payments
Creating a Cash Flow Forecast • Beginning balance of cash and investments • Monthly revenue projections • Monthly expenditure projections • Projected net change • Projected cumulative balance of cash and investments
Estimate Timing of Investments • Schedule of current investments • List of maturity dates • Schedule of income payments
Required Liquidity • Look at the projected net cash flows and hold the amount required to meet the largest negative month and add a margin of safety • Establish a required minimum cash balance that you would prefer to have available.
Review Cash Forecast • Compare actual versus forecast • Identify reasons for variances • Adjust assumptions if warranted • Follow up with department heads on capital project slippage • Update database for accurate future projection • Retain documentation for future reference
Last saved: Thursday, July 19, 2012 at 7:29 PM Portfolio Management
Active Management Strategies • There are three primary drivers of performance for high quality short-term fixed income portfolios: • Duration management • Sector allocation • Security selection
Last saved: Thursday, July 19, 2012 at 7:29 PM Duration Management
Cash Flow Analysis To determine how much money you have to invest in your core portfolio and for how long, you need to analyze some basic cash flow projections. Here is an illustration of what that could look like.
Traditional Portfolio Structure Liquidity Portion of Portfolio 30% 1 to 3 Year Portion of Portfolio 70% • Utilizes traditional money market sectors • Manages liquidity and credit risks • Enables timely reinvestment of cash flows • Captures best duration risk-adjusted returns with the “reserve” portion of the portfolio • Allocates to government and high quality sectors, ensuring liquidity if needed • Insulates portfolio return from interest rate volatility, enhancing portfolio performance
Analyzing the Risk/Return Tradeoff Return vs. Number of Negative Quarters January 1, 2003 to December 31, 2012 Source: Bloomberg
Reduces Volatility of Returns Source: Bloomberg
Last saved: Thursday, July 19, 2012 at 7:29 PM Duration Management - Looking Forward
Duration Management Source: Bloomberg
Yield Curve - top of the interest rate cycle The curve is inverted, enticing investors to stay short. -40 Basis Points Lengthen Maturity Source: Bloomberg
Yield Curve - bottom of the interest rate cycle The curve is steeply sloped, enticing investors to extend maturities, lower quality or take on extension risk. 71 basis points Source: Bloomberg
Last saved: Thursday, July 19, 2012 at 7:29 PM Sector Allocation
Sector Allocation - Treasury, Agency & Corporate Source: Bloomberg
Sector Allocation – Treasury, Agency & Corporate Source: Bloomberg
Sector Allocation - Treasury to Agency Spreads Source: Bloomberg
Sector Allocation – Corporate MTN Disclaimer: All securities shown in this presentation are shown for the purpose of instruction only and are not recommendations to buy or sell a specific security. Cutwater Asset Management acts solely as an investment advisor and not as a broker dealer. Source: Bloomberg
Sector Allocation – Corporate MTN Source: Bloomberg
Last saved: Thursday, July 19, 2012 at 7:29 PM Security Selection – Security Structure
Security Selection - Structure Source: Bloomberg
Security Selection - Structure The structure of a callable security greatly affects both the bond’s duration and performance. Extension risk is a big issue with callable securities. 1,695 days 235 days Source: Bloomberg
Security Selection - Structure Mortgage backed securities may provide a performance opportunity for a small portion of the portfolio. Source: Bloomberg
Last saved: Thursday, July 19, 2012 at 7:29 PM Security Selection – Credit Analysis
Practical Example – credit analysis Lehman Brothers MTN 7 7/8% of August 2010 3/1/08 A+ rated 9/12/08 A rated 6/2/08 A rated 9/15/08 CCC- rated March 17th 2008 “JPMorgan scoops up troubled Bear” CNN 9/16/08 D rated “Many will say that standalone investment banks’ days are numbered”
Practical Example – credit analysis Lehman Brothers Stock