Download

1 / 60
600 likes | 822 Views
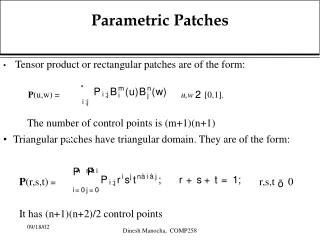
4.1 Feature: Point and Patches. Xuejin Chen Reading: Szeliski Chap. 4 222~238. 4.1.2 Feature Descriptor. Feature Descriptors. We know how to detect good points Next question: How to match them?. ?. Feature Descriptors. ?. Lots of possibilities (this is a popular research area)

E N D
4.1 Feature: Point and Patches Xuejin Chen Reading: Szeliski Chap. 4 222~238
Feature Descriptors We know how to detect good points Next question: How to match them? ?
Feature Descriptors ? Lots of possibilities (this is a popular research area) • Simple option: match square windows around the point • State of the art approach: SIFT • David Lowe, UBC http://www.cs.ubc.ca/~lowe/keypoints/
Feature Descriptors • Sum of Squared Difference (SSD) • Normalized Cross-Correlation (NCC) • For small motion: video stereo, tracking… • Time consuming and sensitive to noise, transforms..
Invariance Suppose we are comparing two images I1 and I2 • I2 may be a transformed version of I1 • What kinds of transformations are we likely to encounter in practice? We’d like to find the same features regardless of the transformation • This is called transformational invariance • Most feature methods are designed to be invariant to • Translation, 2D rotation, scale • They can usually also handle • Limited 3D rotations (SIFT works up to about 60 degrees) • Limited affine transformations (some are fully affine invariant) • Limited illumination/contrast changes
How to Achieve Invariance Need both of the following: • Make sure your detector is invariant • Harris is invariant to translation and rotation • Scale is trickier • common approach is to detect features at many scales using a Gaussian pyramid (e.g., MOPS) • More sophisticated methods find “the best scale” to represent each feature (e.g., SIFT) 2. Design an invariant feature descriptor • A descriptor captures the information in a region around the detected feature point • The simplest descriptor: a square window of pixels • What’s this invariant to? • Let’s look at some better approaches…
Rotation Invariance for Feature Descriptors Find dominant orientation of the image patch • This is given by x+, the eigenvector of H corresponding to + • + is the larger eigenvalue • Rotate the patch according to this angle Figure by Matthew Brown
MultiscaleOriented PatcheS descriptor Take 40x40 square window around detected feature • Scale to 1/5 size (using prefiltering) • Rotate to horizontal • Sample 8x8 square window centered at feature • Intensity normalize the window by subtracting the mean, dividing by the standard deviation in the window 40 pixels 8 pixels Adapted from slide by Matthew Brown
Scale Invariant Feature Transform • Basic idea: • Take 16x16 square window around detected feature • Compute edge orientation (angle of the gradient - 90) for each pixel • Throw out weak edges (threshold gradient magnitude) • Create histogram of surviving edge orientations angle histogram 2 0 Adapted from slide by David Lowe
SIFT Descriptor • Full version • Divide the 16x16 window into a 4x4 grid of cells (2x2 case shown below) • Compute an orientation histogram for each cell • 16 cells * 8 orientations = 128 dimensional descriptor Adapted from slide by David Lowe
Properties of SIFT Extraordinarily robust matching technique • Can handle changes in viewpoint • Up to about 60 degree out of plane rotation • Can handle significant changes in illumination • Sometimes even day vs. night (below) • Fast and efficient—can run in real time • Lots of code available • http://people.csail.mit.edu/albert/ladypack/wiki/index.php/Known_implementations_of_SIFT
PCA-SIFT Ke and Sukthankar 2004 • 39x39 patches • Ix, Iy • 39x39x2=3021 D vector 36 D using Principle Component Analysis
Gradient Location-Orientation Histogram (GLOH) Mikolajczyk and Schmid 2005 • Log-polar binning structure instead of four quadrants • 17 spatial bins * 16 orientation bins = 272 D • PCA -> 128 D Best performance overall
Maximally Stable Extremal Regions J.Matas et.al. “Distinguished Regions for Wide-baseline Stereo”. BMVC 2002. • Maximally Stable Extremal Regions • Threshold image intensities: I > threshfor several increasing values of thresh • Extract connected components(“Extremal Regions”) • Find a threshold when region is “Maximally Stable”, i.e. local minimumof the relative growth • Approximate each region with an ellipse
Performance of Local Descriptor • Comparison in • GLOH > SIFT > others Mikolajczyk and Schmid 2005
Many New Descriptors • Many newer techniques: tuning parameters.. • Trained from large database • Class- or instance- specific features…
4.1.3 Feature Matching Given a feature in I1, how to find the best match in I2? • Define distance function that compares two descriptors • Test all the features in I2, find the one with min distance • Efficient data structures and algorithms
Feature Distance How to define the difference between features f1, f2? • Simple approach is SSD(f1, f2) • Sum of square differences between entries of the two descriptors • Can give good scores to very ambiguous (bad) matches f1 f2 I1 I2
Feature Distance How to define the difference between features f1, f2? • Better approach: ratio distance = SSD(f1, f2) / SSD(f1, f2’) • f2 is best SSD match to f1 in I2 • f2’ is 2nd best SSD match to f1 in I2 • gives small values for ambiguous matches f1 f2' f2 I1 I2
Evaluating the Results How can we measure the performance of a feature matcher? 50 75 200 feature distance
True/False Positives The distance threshold affects performance True positives = # of detected matches that are correct Suppose we want to maximize these—how to choose threshold? False positives = # of detected matches that are incorrect Suppose we want to minimize these—how to choose threshold? 50 true match 75 200 false match feature distance Threshold
Performance Evaluation • TP: true positives, i.e., number of correct matches; • FN: false negatives, matches that were not correctly detected; • FP: false positives, proposed matches that are incorrect; • TN: true negatives, non-matches that were correctly rejected.
True/False Positive/Negative • Threshold dashed circle • Green 1: true positive • Blue 1: true positive • 3: false positive • 4: false positive • Black 1, 2: features • Threshold solid circle • Green 1: true positive • Blue 1: false negative • 3: false positive • 4: true negative
Performance Evaluation • Unit rates: • True positive rate (TPR) • False positive rate (FPR) • Positive predictive value (PPV) • Accuracy (ACC)
Confusion Matrix True matches True non-matches Predicted matches Predicted non-matches Ideally, TPR => 1, FPR =>0
# true positives # matching features (positives) # false positives # unmatched features (negatives) Evaluating the Results How can we measure the performance of a feature matcher? 1 0.7 For a specific threshold truepositiverate 0 1 false positive rate 0.1
Evaluating the Results How can we measure the performance of a feature matcher? # true positives # matching features (positives) # false positives # unmatched features (negatives) ROC curve (“Receiver Operator Characteristic”) 1 0.7 Close to upper left corner truepositiverate 0 1 false positive rate 0.1 • ROC Curves • Generated by counting # current/incorrect matches, for different thresholds • Want to maximize area under the curve (AUC) • Useful for comparing different feature matching methods • For more info: http://en.wikipedia.org/wiki/Receiver_operating_characteristic
Performance Evaluation • Give the distribution, look for the best threshold • However, hard to have a clear distribution function • Hard to set a best threshold Distribution of positives and negatives Inter-space distance
Threshold will adapt to different regions of the feature space • Fixed threshold • Db: FN; Dc, De: FP • Nearest Neighbor • Db: TP; Dc: FP Trained from large database to get appropriate threshold • Nearest neighbor distance ratio (NNDR) • Small d1/d2 • Db: TP; Dc, De: TN (Mikolajczyk and Schmid 2005)
Performance Evaluation (Mikolajczyk and Schmid 2005) Fixed threshold
Performance Evaluation (Mikolajczyk and Schmid 2005) Nearest neighbor
Performance Evaluation (Mikolajczyk and Schmid 2005) NNDR
Feature Space • Nearest Neighbor Distance Ratio • Adaptive threshold based on different regions in feature space • Trained from database • ..
Efficient Matching • Compare all features against all others • Quadratic, impractical for most applications • Indexing structure • For individual image, or globally for all images • Multi-dimensional search tree • Hash table • Vocabulary tree • …
Efficient Matching • Multi-dimensional hashing • Map descriptor into fixed size buckets • When matching, new feature is hashed into a bucket • Search for nearby buckets to return potential candidates 1 2 3 N ……
Haar Wavelets MOPS, Brown, Szeliski, andWinder (2005) • 3D index by performing sum over the quadrants • Normalize the 3 values by their expected standard deviations • V_n two nearest bins (of 10) index 2^3 = 8 bins • Query: primary 3D bin, k nearest neighbors for further process
More Structures Page 232, 233 • Locality Sensitive Hashing • More widely applicable • Use unions of independently computed hashing functions to index the features • Parameter-Sensitive Hashing • More sensitive to the distribution of points in parameter space • High-D vectors to binary codes • Compared using Hamming distance • Accommodate arbitrary kernel functions
KD Tree • Multi-dimensional search tree • Recursively divide multi-D feature space along alternating axis-aligned hyperplanes • Choose the threshold along each axis so as to maximize some criterion (tree balance, maximum depth as small as possible…) • Query: nearby bins
Additional Data Structure Page 234 • Slicing • use a series of 1D binary searches on point list sorted along different dimensions to efficiently cull down a list of candidate points that lie within a hypercube of the query point • Reweight the matches at different levels of the indexing tree • Less sensitive to discretization errors in tree construction • Metric tree • A small number of prototypes at each level in a hierarchy • Visual words classical information retrieval, fast
Indexing Structure • Survey and comparison on indexing structures • Kd tree works best • Rapid computation of image feature correspondences remains a challenging open research problem Muja and Lowe (2009)
Verification and Densification • Geometry alignment to verify • Inliers and outliers • RANSAC, Random sampling • Will be discussed further in next sections
4.1.4 Feature Tracking • Find features in all candidate images • Detect in one then search in others • Detect and track: for video tracking applications, where the expected amount of motion and appearance deformation between adjacent frames in expected to be small • Subsequent frames • SSD works well • NCC is better if there is brightness change • Hierarchical search strategy when search range is large: matches in lower resolution images to provide better initial guesses and speed up the search
4.1.4 Feature Tracking • Long image sequence: large appearance change • Whether to continue matching against the originally detected patch or • Re-sample each subsequent frame at the matching location Fail when original patch apperance changes such as foreshotening Risk: features drift from its original location
Feature Tracking (Shi and Tomasi 1994) • Affine motion model • Compare patches in neighboring frames using a translational model • Use the location to initialize an affine registration between the patch in the current frame and the base frame • The area around the predicted feature location is searched with an incremental registration algorithm • Kanade–Lucas–Tomasi (KLT) tracker. Detect new features in regions where the tracking has fail
A lot of Expansions Page 236 • Tracking combined with structure from motion • Tie together the corners • Tracking in video with large number of moving objects or points • Special purpose recognizer: Learning algorithms • Train classifiers on sample patches and their affine deformation, fast and reliable, fast motion is supported • Survey … (Yilmaz, Javed, and Shah 2006)
Real-time head tracking using the fast trained classifiers of Lepetit, Pilet, and Fua (2004) 2004 IEEE.
Application: Performance-driven animation • Expression and head tracking • Morph among a series of hand-drawn sketches Buck, Finkelstein, Jacobs et al. (2000)