Download
1 / 43
430 likes | 624 Views
STAT 101 Dr. Kari Lock Morgan. Simple Linear Regression. SECTION 2.6, 9.1 Least squares line Interpreting coefficients Prediction Cautions Inference for slope, correlation. Review. ANOVA is used to test for an association between Two categorical variables

E N D
STAT 101 Dr. Kari Lock Morgan Simple Linear Regression • SECTION 2.6, 9.1 • Least squares line • Interpreting coefficients • Prediction • Cautions • Inference for slope, correlation
Review • ANOVA is used to test for an association between • Two categorical variables • One categorical and one quantitative variable • Two quantitative variables
Review • A 2 test is used to test for an association between • Two categorical variables • One categorical and one quantitative variable • Two quantitative variables
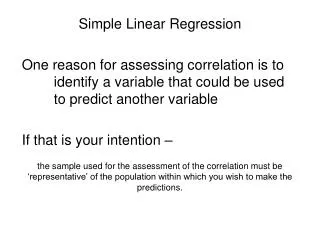
Crickets and Temperature • Can you estimate the temperature on a summer evening, just by listening to crickets chirp? • We will fit a model to predict temperature based on cricket chirp rate
Crickets and Temperature Response Variable, y Explanatory Variable, x
Linear Model A linear modelpredicts a response variable, y, using a linear function of explanatory variables Simple linear regressionpredicts on response variable, y, as a linear function of one explanatory variable, x
Regression Line • Goal: Find a straight line that best fits the data in a scatterplot
Equation of the Line The estimated regression line is Intercept Slope where x is the explanatory variable, and is the predicted response variable. • Slope: increase in predicted y for every unit increase in x • Intercept: predicted y value when x = 0
Regression Model Which is a correct interpretation? • The average temperature is 37.68 • For every extra 0.23 chirps per minute, the predicted temperate increases by 1 degree • Predicted temperature increases by 0.23 degrees for each extra chirp per minute • For every extra 0.23 chirps per minute, the predicted temperature increases by 37.68
Units • It is helpful to think about units when interpreting a regression equation y units y units x units degrees/ chirps per min chirps per minute degrees degrees
Prediction • The regression equation can be used to predict y for a given value of x • If you listen and hear crickets chirping about 140 times per minute, your best guess at the outside temperature is
Prediction • If the crickets are chirping about 180 times per minute, your best guess at the temperature is • 60 • 70 • 80
Prediction • The intercept tells us that the predicted temperature when the crickets are not chirping at all is 37.68. Do you think this is a good prediction? • (a) Yes • (b) No
Regression Caution 1 • Do not use the regression equation or line to predict outside the range of x values available in your data (do not extrapolate!) • If none of the x values are anywhere near 0, then the intercept is meaningless!
Duke Rank and Duke Shirts • Are the rank of Duke among schools applied to and the number of Duke shirts owned • positively associated • negatively associated • not associated • other
Regression Caution 2 • Computers will calculate a regression line for any two quantitative variables, even if they are not associated or if the association is not linear • ALWAYS PLOT YOUR DATA! • The regression line/equation should only be used if the association is approximately linear
Regression Caution 3 • Outliers (especially outliers in both variables) can be very influential on the regression line • ALWAYS PLOT YOUR DATA! • http://illuminations.nctm.org/LessonDetail.aspx?ID=L455
Life Expectancy and Birth Rate Which of the following interpretations is correct? A decrease of 0.89 in the birth rate corresponds to a 1 year increase in predicted life expectancy Increasing life expectancy by 1 year will cause birth rate to decrease by 0.89 Both Neither Coefficients: (Intercept) LifeExpectancy 83.4090 -0.8895
Regression Caution 4 • Higher values of x may lead to higher (or lower) predicted values of y, but this does NOT mean that changing x will cause y to increase or decrease • Causation can only be determined if the values of the explanatory variable were determined randomly (which is rarely the case for a continuous explanatory variable)
Explanatory and Response • Unlike correlation, for linear regression it does matter which is the explanatory variable and which is the response
Regression Line • How do we find the best fitting line???
Predicted and Actual Values • The actual response value, y, is the response value observed for a particular data point • The predicted response value, , is the response value that would be predicted for a given x value, based on a model • In linear regression, the predicted values fall on the regression line directly above each x value • The best fitting line is that which makes the predicted values closest to the actual values
Residual The residualfor each data point is actual – predicted = • The residual is also the vertical distance from each point to the line
Residual • Want to make all the residuals as small as possible. • How would you measure this?
Least Squares Regression Least squares regressionchooses the regression line that minimizes the sum of squared residuals
Sample to Population • Everything we have done so far is based solely on sample data • Now, we will extend from the sample to the population
Simple Linear Model • The population/true simple linear model is • 0 and 1, are unknown parameters • Can use familiar inference methods! Intercept Slope Random error
Inference for the Slope • Confidence intervals and hypothesis tests for the slope can be done using the familiar formulas: • Population Parameter: 1, Sample Statistic: • Use t-distribution with n – 2 degrees of freedom
Inference for Slope Give a 95% confidence interval for the true slope. Is the slope significantly different from 0? (a) Yes (b) No
Correlation Test • Test for a correlation between temperature and cricket chirps (r = 0.9906).
Two Quantitative Variables • The t-statistic (and p-value) for a test for a non-zero slope and a test for a non-zero correlation are identical! • They are equivalent ways of testing for an association between two quantitative variables.
Small Samples • The t-distribution is only appropriate for large samples (definitely not n = 7)! • We should have done inference for the slope using simulation methods...
r = 0 • Challenge: If the correlation between x and y is 0, what would the regression line be?
To Do • Read Section 2.6, 9.1 • Do HW 7 (due Monday, 3/31) • NO LATE HOMEWORK ACCEPTED – SOLUTIONS WILL BE POSTED IMMEDIATELY AFTER CLASS TO HELP YOU PREPARE FOR EXAM 2