Download
1 / 6
60 likes | 239 Views
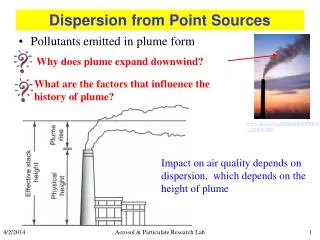
Group Velocity Dispersion Curves from Wigner-Ville Distributions. Simon Lloyd 1 , Goetz Bokelmann 1 , Victor Sucic 2 1 University of Vienna 2 University of Rijeka. Multiple Filter Technique. MFT was introduced by Dziewonski et al. in 1969. Method to measure surface wave group velocities.

E N D
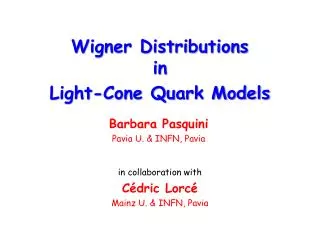
Group Velocity Dispersion Curves from Wigner-Ville Distributions Simon Lloyd1, Goetz Bokelmann1, Victor Sucic2 1University of Vienna 2University of Rijeka
Multiple Filter Technique • MFT was introduced by Dziewonski et al. in 1969. • Method to measure surface wave group velocities. • Countless studies have used MFT to determine group velocity dispersion curves of surface waves invert for velocity structure. • Here we compare MFT with an alternative time-frequency method: Wigner-Ville Distribution.
MFT vs. WV: Teleseismic Event Compared to MFT, Wigner-Ville produces a sharper outline of group velocity dispersion. This becomes even more evident after normalisingthe contour plots (the maximum amplitude for each period is the same). This is nice, but to better compare the methods we must use synthetic seismograms with known dispersion.
Synthetic Data The noise spectrum at seismic stations is not flat, and the amplitudes can thus vary significantly. We simulate best/worst case scenarios using Peterson’s (1993) noise models. Peterson (1993) The synthetic seismogram used for testing is the vertical component of a Mw=3.2, 45° dip slip earthquake at 200 km distance using the PREM Earth model. Noise free trace Low noise added High noise added
Observations from synthetics The random low noise is very small compared to the signal amplitudes. WV constrains dispersion better than MFT, but doesn’t do as well at shorter periods. The random high noise mostly affects short periods, where both methods struggle at detecting the dispersed signal.
Conclusions • Both multiple filtering and Wigner-Ville yield similar results when measuring group velocity dispersion. • MFT appears more robust over a wider frequency range. • Wigner-Ville is more sensitive and better constrains dispersion measurements. • The two methods may complement each other, whereby MFT allows measuring dispersion over a wider frequency range and Wigner-Ville tells us about the true quality of the measurements.