Download
1 / 9
100 likes | 116 Views
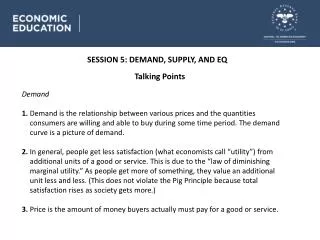
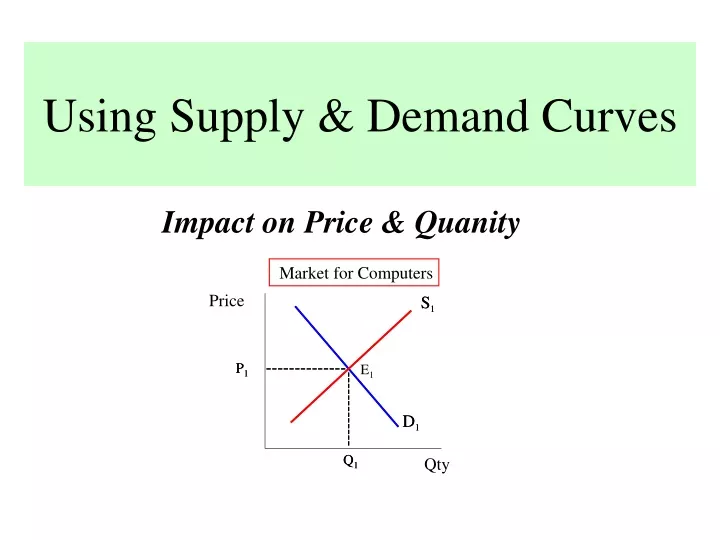
Using Supply & Demand Curves. Impact on Price & Quanity. Event: New study reveals almond butter cures cancer. -----------. P 2. ---------. D 2. Q 2. Equilibrium Px ↓ & Qty ↓. Sample Problem. TIPSEN ↓ Tastes ↓ ↓ Leads to

E N D
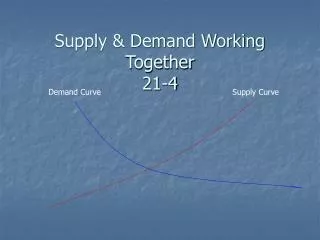
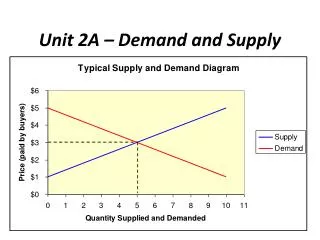
Using Supply & Demand Curves Impact on Price & Quanity
Event: New study reveals almond butter cures cancer ----------- P2 --------- D2 Q2 Equilibrium Px ↓ & Qty ↓ Sample Problem • TIPSEN • ↓ • Tastes ↓ • ↓ • Leads to • ↓ • Decrease (change) in Demand • & • 2) ↓ in QUANTITY Supplied Peanut Butter Price S1 P1 -------------- E1 E2 ------------- D1 Q1 Qty
Impacts of Shifting only 1 Curve DEMAND Shift in Curve Price Qty R Increases Decreases L Demand shifts move Price & Qty in same direction SUPPLY Shift in Curve Price Qty Increases R Decreases L Supply shifts moves Price & Qty in opposite directions
Income Inequality Low Skilled Workers Price (Wages) S1 S2 Demand decreasing => Px (wages) ↓ Qty ↓ -------------- E1 $10 Supply increasing => ------------- D1 D2 Px (wages) ↓ Qty ↑ Q1 Qty Final Result: Price (wages) must fall & Quantity is indeterminate
Equilibrium Price Equilibrium Quantity When Both S & D Curves Shift: • 1 variable is predictable (priceorquantity) • The other variable is indeterminate 2 Variables: or One is indeterminate (whenever both curves shift)
What’s going on with oil/gas? $90 barrel to $40 Oil Market Price S1 S2 -------------- $9000 E1 Supply increasing => Px ↓ Qty ↑ ------------- E2 D1 Demand decreasing => Px ↓ Qty ↓ D2 Q1 Qty Final Result: Price must fall & Quantity is indeterminate
Physical Capital vs. Human Capital http://www.youtube.com/watch?v=8_lfxPI5ObM
S2 P2 P2 D2 Q2 Q2 Qty Qty P P P Result if both shifts occur: S1 Quantity will increase. P1 Price is Indeterminate D1 Variable that moves in opposite directions is indeterminate Qty Q Result if only one shift happens: Increase in demand: Increase in supply: