Download
1 / 41
410 likes | 425 Views
Delve into the correlation between money and happiness, dissecting the Easterlin Paradox and its implications on subjective well-being. Discover how factors like income, social connections, and health influence life satisfaction and joy. Uncover the nuances of economic growth and human development beyond GDP, shedding light on the complexity of achieving true happiness. Explore the intricacies of measuring happiness and the various indicators that impact individual well-being, from smiling frequency to recent positive life changes. Join the discussion on the evolving understanding of happiness in the context of economic progress and societal development.

E N D
All is not money! • Correlation between money and happiness?
Implications of Easterlin Paradox • Economic Sociologists: Relative Income • UN: Human Development Index (as opposed to GDP) • Environmental Movement: No growth
New Research • Problem with Easterlin Paradox: • Old data (1974) • Few countries in the data set • Gallup conducted a poll in 2006. • World Values Survey: respondents in 81 countries are asked, “All things considered, how satisfied are you with your life as a whole these days?” (life satisfaction index) • Very satisfied, fairly satisfied, not very satisfied, or not satisfied (1-4) • The General Social Survey (GSS) similarly asks Americans, “Taken all together, how would you say things are these days? Would you say that you are very happy, pretty happy, or not too happy?” (happiness index) • Analyzed by Stevenson and Wolfers (2008)
Are these measures of Happiness Good? • Measured Happiness correlates well with: • Smiling frequency • Smiling with the eyes (“unfakeable smile”) • Ratings of one’s happiness made by friends • Frequent verbal expressions of positive emotions • Sociability and extraversion • Sleep quality • Happiness of close relatives • Self-reported health • Recent positive changes of circumstances (increased income, marriage) • Sources: Diener and Suh (1999), Layard (2005) and Frey and Stutzer (2002).
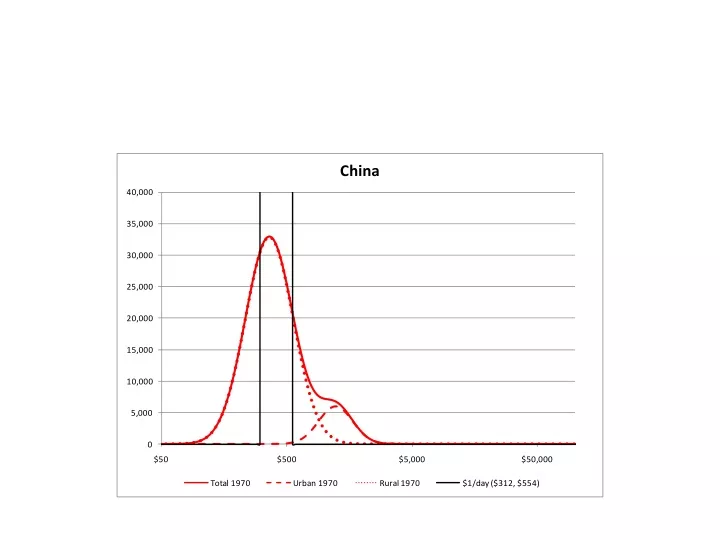
Source: Stevenson and Wolfers (2008). Economic Growth and Subjective Well-Being: Reassessing the Easterlin Paradox*
A Schematic View of Development(with minor complicating factors) The exclusion restrictions Accumulation of factors Technological innovation or adoption Policies giving the “right” incentives Geography Deep history Institutions Development Let’s not let these minor complicating factors get in the way… The point is there are increasingly rigid backward constraints Reverse causality 36
Per Hour of Work • With ONE HOUR OF WORK • We can purchase 840,000 time more light than the australopithecus • We can purchase 45,000 times more light than the XVIII man • Inventions that lower the price of things matter a lot!!