Download
1 / 3
0 likes | 27 Views
This guide delves into the essential tools and concepts for front end monitoring, leveraging distributed tracing for in-depth analysis, and understanding the distinctions between observability and APM (Application Performance Monitoring). By mastering these techniques, you can gain a comprehensive understanding of your application's behavior and proactively address issues before they impact users.

E N D
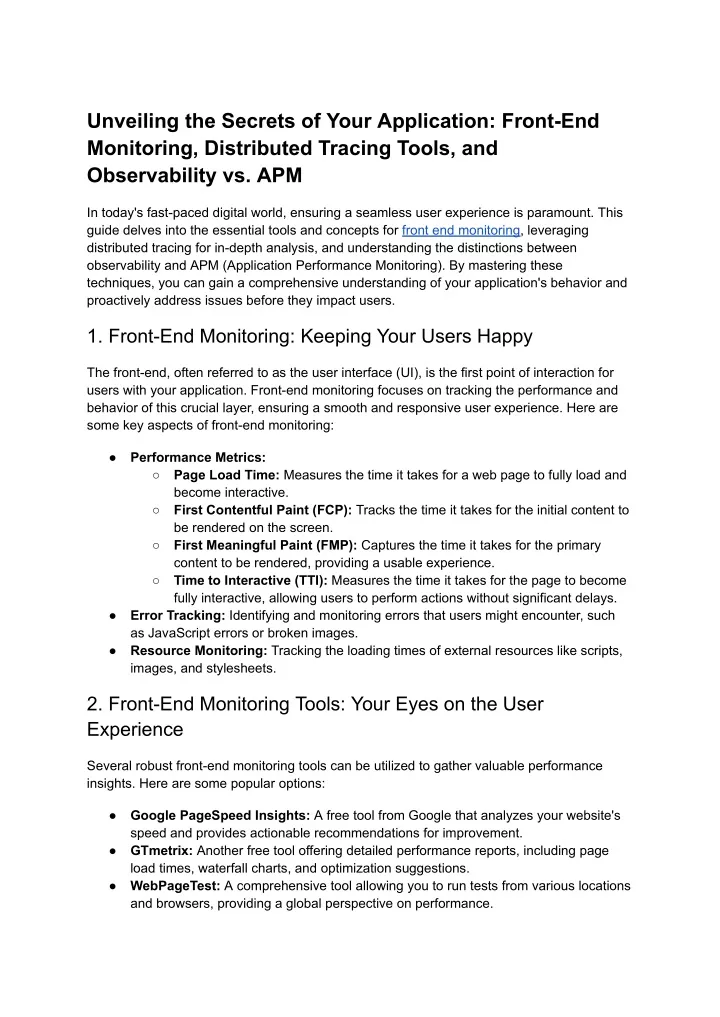
Unveiling the Secrets of Your Application: Front-End Monitoring, Distributed Tracing Tools, and Observability vs. APM In today's fast-paced digital world, ensuring a seamless user experience is paramount. This guide delves into the essential tools and concepts for front end monitoring, leveraging distributed tracing for in-depth analysis, and understanding the distinctions between observability and APM (Application Performance Monitoring). By mastering these techniques, you can gain a comprehensive understanding of your application's behavior and proactively address issues before they impact users. 1. Front-End Monitoring: Keeping Your Users Happy The front-end, often referred to as the user interface (UI), is the first point of interaction for users with your application. Front-end monitoring focuses on tracking the performance and behavior of this crucial layer, ensuring a smooth and responsive user experience. Here are some key aspects of front-end monitoring: ● Performance Metrics: ○ Page Load Time: Measures the time it takes for a web page to fully load and become interactive. ○ First Contentful Paint (FCP): Tracks the time it takes for the initial content to be rendered on the screen. ○ First Meaningful Paint (FMP): Captures the time it takes for the primary content to be rendered, providing a usable experience. ○ Time to Interactive (TTI): Measures the time it takes for the page to become fully interactive, allowing users to perform actions without significant delays. Error Tracking: Identifying and monitoring errors that users might encounter, such as JavaScript errors or broken images. Resource Monitoring: Tracking the loading times of external resources like scripts, images, and stylesheets. ● ● 2. Front-End Monitoring Tools: Your Eyes on the User Experience Several robust front-end monitoring tools can be utilized to gather valuable performance insights. Here are some popular options: ● Google PageSpeed Insights: A free tool from Google that analyzes your website's speed and provides actionable recommendations for improvement. GTmetrix: Another free tool offering detailed performance reports, including page load times, waterfall charts, and optimization suggestions. WebPageTest: A comprehensive tool allowing you to run tests from various locations and browsers, providing a global perspective on performance. ● ●
● Browser Developer Tools: Built-in developer tools offered by most browsers (Chrome DevTools, Firefox Developer Tools) provide real-time performance data and error tracking capabilities. 3. The Power of Distributed Tracing: Unveiling Application Workflows Modern web applications often involve a complex ecosystem of microservices interacting behind the scenes. Distributed tracing tools shed light on this choreography by tracking the flow of a single user request across various services. This enables you to identify bottlenecks, pinpoint errors, and gain a holistic understanding of how your application functions. 4. Distributed Tracing Tools in Action: A Real-World Example Imagine a user placing an order on an e-commerce website. A distributed tracing tool would enable you to track the journey of this request: ● ● ● User submits the order form on the front-end. The front-end sends data to the backend API. The backend API calls various microservices: ○ Product service to retrieve product information. ○ Inventory service to check product availability. ○ Payment gateway to process the payment. ○ Shipping service to generate shipping labels. Each microservice records its processing time and interacts with databases or external services. ● 5. Utilizing Distributed Tracing Tools for Enhanced Observability Distributed tracing tools empower you to: ● Identify Performance Bottlenecks: Pinpoint the specific microservice or API call 6. Observability vs. APM: Understanding the Nuancescausing delays in the overall user request flow. Debug Complex Issues: Understand how errors propagate through different services, facilitating effective troubleshooting. Root Cause Analysis: Isolate the source of an issue within the intricate web of microservices. Improved Development Efficiency: Streamline development by providing insights into how code changes impact overall performance. ● ● ● While observability vs APM are closely related, they represent distinct approaches to monitoring software behavior. Here's a breakdown of their key differences:
Observability: ● Focus: Obtaining a holistic view of system health by collecting data from various sources (logs, metrics, traces) Data Collection: Agnostic to data type, gathering logs, metrics, and traces Flexibility: Applicable to various types of systems, including front-end, backend, and infrastructure Goal: Comprehensive understanding of system behavior to identify and resolve issues ● ● ● APM (Application Performance Monitoring): ● Focus: Monitoring application performance specifically, often focusing on metrics and tracing Data Collection: Primarily metrics and tracing data relevant to application performance Scope: Primarily focused on backend application behavior ● ●