Download
1 / 72
730 likes | 770 Views
Learn about time series, stochastic processes, and ARMA models. Explore trend analysis, unit root tests, and estimation techniques using real-world examples. Improve your econometrics skills with practical knowledge.

E N D
Contents • Time Series • Stochastic Processes • Stationary Processes • The ARMA Process • Deterministic and Stochastic Trends • Models with Trend • Unit Root Tests • Estimation of ARMA Models Hackl, Econometrics 2, Lecture 3
Private Consumption Private consumption in the EURO area (16 mem- bers), quarterly data, seasonally adjusted, AWM database (in MioEUR) Hackl, Econometrics 2, Lecture 3
Private Consumption: Growth Rate Yearly growth of private consumption in EURO area (16 members), AWM database (in MioEUR) Mean growth: 15.008 Hackl, Econometrics 2, Lecture 3
Disposable Income Disposable income, Austria (in Mio EUR) Hackl, Econometrics 2, Lecture 3
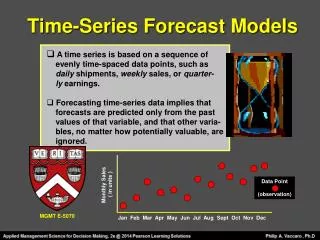
Time Series • Time-ordered sequence of observations of a random variable • Examples: • Annual values of private consumption • Yearly changes in expenditures on private consumption • Quarterly values of personal disposable income • Monthly values of imports • Notation: • Random variable Y • Sequence of observations Y1, Y2, ... , YT • Deviations from the mean: yt = Yt – E{Yt} = Yt – μ Hackl, Econometrics 2, Lecture 3
Components of a Time Series • Components or characteristics of a time series are • Trend • Seasonality • Irregular fluctuations • Time series model: represents the characteristics as well as possible interactions • Purpose of modeling • Description of the time series • Forecasting the future • Example: Quarterly observations of the disposable income • Yt = βt + ΣiγiDit + εt • with Dit = 1 if t corresponds to i-th quarter, Dit = 0 otherwise Hackl, Econometrics 2, Lecture 3
Contents • Time Series • Stochastic Processes • Stationary Processes • The ARMA Process • Deterministic and Stochastic Trends • Models with Trend • Unit Root Tests • Estimation of ARMA Models Hackl, Econometrics 2, Lecture 3
Stochastic Process Time series: realization of a stochastic process Stochastic process is a sequence of random variables Yt, e.g., {Yt, t = 1, ..., n} {Yt, t = -∞, ..., ∞} Joint distribution of the Y1, ... , Yn: p(y1, …., yn) Of special interest • Evolution of the expectation mt = E{Yt} over time • Dependence structure over time Example: Extrapolation of a time series as a tool for forecasting Hackl, Econometrics 2, Lecture 3
White Noise White noise process {Yt, t = -∞, ..., ∞} • E{Yt} = 0 • V{Yt} = σ² • Cov{Yt,Yt-s} = 0 for all (positive or negative) integers s i.e., a mean zero, serially uncorrelated, homoskedastic process Hackl, Econometrics 2, Lecture 3
AR(1)-Process States the dependence structure between consecutive observations as Yt = δ + θYt-1 + εt, |θ| < 1 with εt: white noise, i.e., V{εt} = σ² (see next slide) • Autoregressive process of order 1 From Yt = δ + θYt-1 + εt = δ + θδ + θ²δ +… +εt + θεt-1 + θ²εt-2 +… follows E{Yt} = μ = δ(1-θ)-1 • |θ| < 1 needed for convergence! Invertibility condition In deviations from μ, yt = Yt – m: yt = θyt-1 + εt Hackl, Econometrics 2, Lecture 3
AR(1)-Process, cont’d Autocovariances γk = Cov{Yt,Yt-k} • k=0: γ0 = V{Yt} = θ²V{Yt-1} + V{εt} = … = Σi θ2i σ² = σ²(1-θ²)-1 • k=1: γ1 = Cov{Yt,Yt-1} = E{ytyt-1} = E{(θyt-1+εt)yt-1} = θV{yt-1} = θσ²(1-θ²)-1 • In general: γk = Cov{Yt,Yt-k} = θkσ²(1-θ²)-1, k = 0, ±1, … depends upon k, not upon t! Hackl, Econometrics 2, Lecture 3
MA(1)-Process States the dependence structure between consecutive observations as Yt = μ + εt + αεt-1 with εt: white noise, V{εt} = σ² Moving average process of order 1 E{Yt} = μ Autocovariances γk = Cov{Yt,Yt-k} • k=0: γ0 = V{Yt} = σ²(1+α²) • k=1: γ1 = Cov{Yt,Yt-1} = ασ² • γk = 0 for k = 2, 3, … • Depends upon k, not upon t! Hackl, Econometrics 2, Lecture 3
AR-Representation of MA-Process The AR(1) can be represented as MA-process of infinite order yt = θyt-1 + εt = Σ∞i=0 θiεt-i given that |θ| < 1 Similarly: the AR representation of the MA(1) process yt = αyt-1 – α²yt-2± … + εt = Σ∞i=0 (-1)i αi+1yt-i-1 + εt given that |α| < 1 Hackl, Econometrics 2, Lecture 3
Contents • Time Series • Stochastic Processes • Stationary Processes • The ARMA Process • Deterministic and Stochastic Trends • Models with Trend • Unit Root Tests • Estimation of ARMA Models Hackl, Econometrics 2, Lecture 3
Stationary Processes Refers to the joint distribution of Yt’s, in particular to second moments (Weak) stationary or covariance stationary process: the first two moments are finite and not affected by a shift of time E{Yt} = μfor all t Cov{Yt, Yt+k} = γk, k = 0, ±1, … for all t and all k Cov{Yt, Yt+k}, k = 0, ±1,…: covariance function; γt,k = γt,-k A process is called strictly stationary if its stochastic properties are unaffected by a change of the time origin • The joint probability distribution at any set of times is not affected by an arbitrary shift along the time axis Hackl, Econometrics 2, Lecture 3
AC and PAC Function Autocorrelation function (AC function, ACF) Independent of the scale of Y • For a stationary process: ρk = Corr{Yt,Yt-k} = γk/γ0, k = 0, ±1,… • Properties: • |ρk| ≤ 1 • ρk = ρ-k • ρ0 = 1 • Correlogram: graphical presentation of the AC function Partial autocorrelation function (PAC function, PACF): θkk = Corr{Yt, Yt-k|Yt-1,...,Yt-k+1}, k = 0, ±1, … • θkk is obtained from Yt = θk0 + θk1Yt-1 + ... + θkkYt-k • Partial correlogram: graphical representation of the PAC function Hackl, Econometrics 2, Lecture 3
Examples for the AC and PAC functions: • White noise ρ0 = θ00 = 1 ρk = θkk = 0, if k≠ 0 white noise is stationary • AR(1) process, Yt = δ + θYt-1 + εt ρk = θk, k = 0, ±1,… θ00 = 1, θ11 = θ, θkk = 0 for k > 1 • MA(1) process, Yt = μ + εt + αεt-1 ρ0 = 1, ρ1= α/(1 + α2), ρk = 0 for k > 1 PAC function: damped exponential if α > 0, alternating and damped exponential if α < 0 Hackl, Econometrics 2, Lecture 3
Stationarity of MA- and AR- Processes MA processes are stationary • Weighted sum of white noises • E.g., MA(1) process: Yt = μ + εt + αεt-1 ρ0 = 1, ρ1= α/(1 + α2), ρk = 0 for k > 1 An AR process is stationary if it is invertible • AR(1) process, Yt = θYt-1 + εt = Σ∞i=0θiεt-i if |θ| < 1 (invertibility condition) ρk = θk, k = 0, ±1,… Hackl, Econometrics 2, Lecture 3
AC and PAC Function: Estimates • Estimator for the AC function ρk: • Estimator for the PAC function θkk: coefficient of Yt-k in the regression of Yt on Yt-1, …, Yt-k Hackl, Econometrics 2, Lecture 3
AR(1) Processes, Verbeek, Fig. 8.1 Hackl, Econometrics 2, Lecture 3
MA(1) Processes, Verbeek, Fig. 8.2 Hackl, Econometrics 2, Lecture 3
Contents • Time Series • Stochastic Processes • Stationary Processes • The ARMA Process • Deterministic and Stochastic Trends • Models with Trend • Unit Root Tests • Estimation of ARMA Models Hackl, Econometrics 2, Lecture 3
The ARMA(p,q) Process Generalization of the AR and MA processes: ARMA(p,q) process yt = θ1yt-1 + … + θpyt-p + εt + α1εt-1 + … + αqεt-q with white noise εt Lag (or shift) operator L (Lyt= yt-1, L0yt = Iyt= yt, Lpyt= yt-p) ARMA(p,q) process in operator notation θ(L)yt = α(L)εt with operator polynomials θ(L) and α(L) θ(L) = I - θ1L - … - θpLp α(L) = I + α1L + … + αqLq Hackl, Econometrics 2, Lecture 3
Lag Operator Lag (or shift) operator L • Lyt = yt-1, L0yt = Iyt = yt, Lpyt = yt-p • Algebra of polynomials in L like algebra of variables Examples: • (I - ϕ1L)(I - ϕ2L) = I – (ϕ1+ ϕ2)L +ϕ1ϕ2L2 • (I - θL)-1 = Σ∞i=0θiLi • MA(∞) representation of the AR(1) process yt = (I - θL)-1εt the infinite sum defined only (e.g., finite variance) if |θ| < 1 • MA(∞) representation of the ARMA(p,q) process yt = [θ(L)]-1α(L)εt similarly the AR(∞) representations; invertibility condition: restrictions on parameters Hackl, Econometrics 2, Lecture 3
Invertibility of Lag Polynomials Invertibility condition for lag polynomial θ(L) = I - θL: |θ| < 1 Invertibility condition for lag polynomial of order 2, θ(L) = I - θ1L - θ2L2 • θ(L) = I - θ1L - θ2L2 = (I - ϕ1L)(I - ϕ2L) with ϕ1+ϕ2 = θ1 and -ϕ1ϕ2 = θ2 • Invertibility conditions: both (I – ϕ1L) and (I – ϕ2L) invertible; |ϕ1| < 1, |ϕ2| < 1 Invertibility in terms of the characteristic equation θ(z) = (1- ϕ1z) (1- ϕ2z) = 0 • Characteristic roots: solutions z1, z2 from (1- ϕ1z) (1- ϕ2z) = 0 z1 = ϕ1-1, z2 = ϕ2-1 • Invertibility conditions: |z1| = |ϕ1-1| > 1, |z2| = |ϕ2-1| > 1 Polynomial θ(L) is not invertible if any solution zi fulfills |zi| ≤ 1 Can be generalized to lag polynomials of higher order Hackl, Econometrics 2, Lecture 3
Unit Root and Invertibility Lag polynomial of order 1: θ(z) = (1-θz) = 0, • Unit root: characteristic root z = 1; implies θ = 1 • Invertibility condition |θ| < 1 is violated, AR process Yt = θYt-1 + εt is non-stationary Lag polynomial of order 2 • Characteristic equation θ(z) = (1- ϕ1z) (1- ϕ2z) = 0 • Characteristic roots zi = 1/ϕi, i = 1, 2 • Unit root: a characteristic root zi of value 1; violates the invertibility condition |z1| = |ϕ1-1| > 1, |z2| = |ϕ2-1| > 1 • AR(2) process Yt is non-stationary AR(p) process: polynomial θ(z) = 1 - θ1z - … - θpLp, evaluated at z = 1, is zero, given Σiθi = 1: Σiθi = 1 indicates a unit root Tests for unit roots are important tools for identifying stationarity Hackl, Econometrics 2, Lecture 3
Contents • Time Series • Stochastic Processes • Stationary Processes • The ARMA Process • Deterministic and Stochastic Trends • Models with Trend • Unit Root Tests • Estimation of ARMA Models Hackl, Econometrics 2, Lecture 3
Types of Trend Trend: The development of the expected value of a process over time; typically an increasing (or decreasing) pattern • Deterministic trend: a function f(t) of the time, describing the evolution of E{Yt} over time Yt = f(t) + εt, εt: white noise Example: Yt = α + βt + εt describes a linear trend of Y; an increasing trend corresponds to β > 0 • Stochastic trend: Yt = δ + Yt-1 + εt or ΔYt = Yt – Yt-1 = δ + εt, εt: white noise • describes an irregular or random fluctuation of the differences ΔYt around the expected value δ • AR(1) – or AR(p) – process with unit root • “random walk with trend” Hackl, Econometrics 2, Lecture 3
Example: Private Consumption Private consumption, AWM database; level values (PCR) and first differences (PCR_D) Mean of PCD_D: 3740 Hackl, Econometrics 2, Lecture 3
20 16 12 8 4 0 -4 -8 -12 10 20 30 40 50 60 70 80 90 100 random walk random walk with trend AR(1) process, δ=0.2, θ=0.7 Trends: Random Walk and AR Process Random walk: Yt= Yt-1 + εt; random walk with trend: Yt= 0.1 +Yt-1 + εt; AR(1) process: Yt= 0.2 + 0.7Yt-1 + εt; εtsimulated from N(0,1) Hackl, Econometrics 2, Lecture 3
Random Walk withTrend The random walk with trend Yt = δ + Yt-1 + εt can be written as Yt = Y0 + δt + Σi≤t εi δ: trend parameter Components of the process • Deterministic growth path Y0 + δt • Cumulative errors Σi≤t εi Properties: • Expectation Y0 + δt is depending on Y0, i.e., on the origin (t=0)! • V{Yt} = σ²t becomes arbitrarily large! • Corr{Yt,Yt-k} = √(1-k/t) • Random walk with trend is non-stationary! Hackl, Econometrics 2, Lecture 3
Random Walk withTrend, cont’d From Corr{Yt,Yt-k} = √(1-k/t) follows • For fixed k,Yt and Yt-k are the stronger correlated, the larger t • With increasing k, correlation tends to zero, but the slower the larger t (long memory property) Comparison of random walk with the AR(1) process Yt = δ + θYt-1 + εt • AR(1) process: εt-i has the lesser weight, the larger i • AR(1) process similar to random walk when θ is close to one Hackl, Econometrics 2, Lecture 3
Non-Stationarity: Consequences AR(1) process Yt = θYt-1 + εt • OLS estimator for θ: • For |θ| < 1: the estimator is • consistent • asymptotically normally distributed • For θ = 1 (unit root) • θ is underestimated • estimator not normally distributed • spurious regression problem Hackl, Econometrics 2, Lecture 3
Integrated Processes In order to cope with non-stationarity • Trend-stationary process: the process can be transformed in a stationary process by subtracting the deterministic trend • E.g., Yt = f(t) + εt with white noise εt: Yt–f(t) = εt is stationary • Difference-stationary process, or integrated process: stationary process can be derived by differencing • E.g.,Yt = δ + Yt-1 + εt, E.g., Yt–Yt-1 = δ + εt is stationary Integrated process: stochastic process Y is called • integrated of order one if the first difference yield a stationary process: Y ~ I(1) • integrated of order d, if the d-fold differences yield a stationary process: Y ~ I(d) Hackl, Econometrics 2, Lecture 3
I(0)- vs. I(1)-Processes I(0) process, e.g.,Yt = δ + εt • Fluctuates around the process mean with constant variance • Mean-reverting • Limited memory I(1) process e.g.,Yt = δ + Yt-1 + εt • Fluctuates widely • Infinitely long memory • Persistent effect of shocks Hackl, Econometrics 2, Lecture 3
Integrated Stochastic Processes Many economic time series show stochastic trends From the AWM Database ARIMA(p,d,q) process: d-th differences follow an ARMA(p,q) process Hackl, Econometrics 2, Lecture 3
Contents • Time Series • Stochastic Processes • Stationary Processes • The ARMA Process • Deterministic and Stochastic Trends • Models with Trend • Unit Root Tests • Estimation of ARMA Models Hackl, Econometrics 2, Lecture 3
Example: Model for a Stochastic Trend Data generation: random walk (without trend): Yt = Yt-1 + εt, εt: white noise • Realization of Yt: is a non-stationary process, stochastic trend • V{Yt}: a multiple of t Specified model: Yt = α + βt + εt • Deterministic trend • Constant variance • Miss-specified model! Consequences for OLS estimator for β • t- and F-statistics: wrong critical limits, rejection probability too large • R2 indicates explanatory potential although Yt random walk without trend • “spurious regression” or “nonsense regression” Hackl, Econometrics 2, Lecture 3
White Noise and Random Walk Computer-generated random numbers • eps: white noise, i.e., N(0,1)-distributed • Y: random walk Yt = Yt-1 + epst Hackl, Econometrics 2, Lecture 3
Random Walk and Deterministic Trend Fitting the deterministic trend model Yt = α + βt + εt to the random walk data results in -0.92 +0.096 t with t-statistic 19.77 for b, R2 = 0.66, and Durbin Watson statistic 0.066 Hackl, Econometrics 2, Lecture 3
How to Model Trends? Specification of • Deterministic trend, e.g., Yt = α + βt + εt: risk of spurious regression, wrong decisions • Stochastic trend: analysis of differences ΔYt if a random walk, i.e., a unit root, is suspected Consequences of spurious regression are more serious Consequences of modeling differences ΔYt: • Autocorrelated errors • Consistent estimators • Asymptotically normally distributed estimators • HAC correction of standard errors, i.e., heteroskedasticity and autocorrelation consistent estimates of standard errors Hackl, Econometrics 2, Lecture 3
Elimination of Trend Random walk Yt = δ + Yt-1 + εt with white noise εt ΔYt = Yt – Yt-1 = δ + εt • ΔYt is a stationary process • A random walk is a difference-stationary or I(1) process Linear trend Yt = α + βt + εt • Subtracting the trend component α + βt provides a stationary process • Yt is a trend-stationary process Hackl, Econometrics 2, Lecture 3
Contents • Time Series • Stochastic Processes • Stationary Processes • The ARMA Process • Deterministic and Stochastic Trends • Models with Trend • Unit Root Tests • Estimation of ARMA Models Hackl, Econometrics 2, Lecture 3
Unit Root Tests AR(1) process Yt = δ + θYt-1 + εt with white noise εt • Dickey-Fuller or DF test (Dickey & Fuller, 1979) Test of H0: θ = 1 against H1: θ < 1, i.e., H0 states Y ~ I(1), Y is non-stationary • KPSS test (Kwiatkowski, Phillips, Schmidt & Shin, 1992) Test of H0: θ < 1 against H1: θ = 1, i.e., H0 states Y ~ I(0), Y is stationary • Augmented Dickey-Fuller or ADF test extension of DF test • Various modifications like Phillips-Perron test, Dickey-Fuller GLS test, etc. Hackl, Econometrics 2, Lecture 3
Dickey-Fuller‘s Unit Root Test AR(1) process Yt = δ + θYt-1 + εt with white noise εt OLS Estimator for θ: Test statistic Distribution of DF • If |θ| < 1: approximately t(T-1) • If θ = 1: Dickey & Fuller critical values DF test for testing H0: θ = 1 against H1: θ < 1 • θ = 1: characteristic equation 1 – θz = 0 has unit root Hackl, Econometrics 2, Lecture 3
Dickey-Fuller Critical Values Monte Carlo estimates of critical values for DF0: Dickey-Fuller test without intercept; Yt = θYt-1 + εt DF: Dickey-Fuller test with intercept; Yt = δ + θYt-1 + εt DFτ: Dickey-Fuller test with time trend; Yt = δ + γt + θYt-1 + εt Hackl, Econometrics 2, Lecture 3
Unit Root Test: The Practice AR(1) process Yt = δ + θYt-1 + εt with white noise εt can be written with π = θ -1 as ΔYt = δ + πYt-1 + εt DF tests H0: π = 0 against H1: π < 0 test statistic for testing π = θ -1 = 0 identical with DF statistic Two steps: • Regression of ΔYt on Yt-1: OLS-estimator for π = θ - 1 • Test of H0: π = 0 against H1: π < 0 based on DF; critical values of Dickey & Fuller Hackl, Econometrics 2, Lecture 3
Example: Price/Earnings Ratio Verbeek’s data set PE: annual time series data on composite stock price and earnings indices of the S&P500, 1871-2002 • PE: price/earnings ratio • Mean 14.6 • Min 6.1 • Max 36.7 • St.Dev. 5.1 • log(PE) • Mean 2.63 • Min 1.81 • Max 3.60 • St.Dev. 0.33 Hackl, Econometrics 2, Lecture 3
Price/Earnings Ratio, cont’d Fitting an AR(1) process to the log(PE) data gives: ΔYt = 0.335 – 0.125Yt-1 with t-statistic -2.569 (for Yt-1) and p-value 0.1021 • p-value of the DF statistic (-2.569): 0.102 • 1% critical value: -3.48 • 5% critical value: -2.88 • 10% critical value: -2.58 • H0: θ = 1 (non-stationarity) cannot be rejected for the log(PE) Unit root test for first differences: ΔΔYt = 0.008 – 0.9935ΔYt-1, DF statistic -10.59, p-value 0.000 (1% critical value: -3.48) • log(PE) is I(1) However: for sample 1871-1990: DF statistic -3.65, p-value 0.006; within the period 1871-1990, the log(PE) is stationary Hackl, Econometrics 2, Lecture 3