Download
1 / 1
10 likes | 118 Views
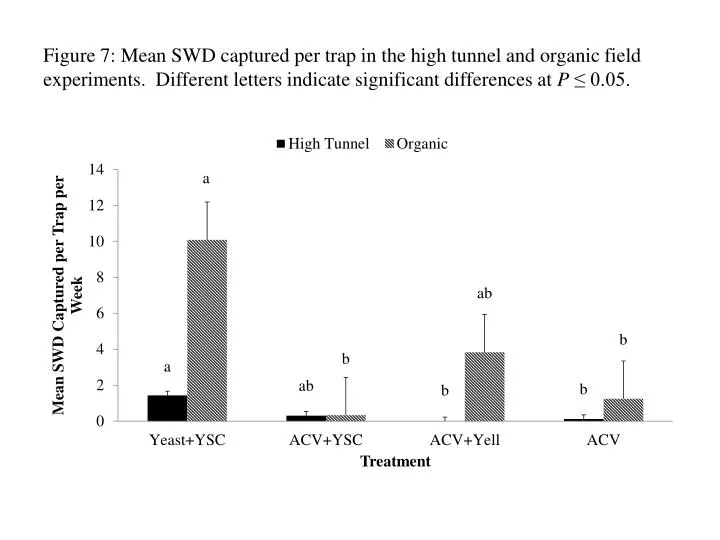
Figure 7: Mean SWD captured per trap in the high tunnel and organic field experiments. Different letters indicate significant differences at P ≤ 0.05.

E N D
Figure 7: Mean SWD captured per trap in the high tunnel and organic field experiments. Different letters indicate significant differences at P ≤ 0.05.
