Download
1 / 1
10 likes | 113 Views
This study compares beam angles and monitor units for supine and prone positions, analyzing the segment, total monitor units, and fields for each position. Results show variations in MU distribution and beam fractions.

E N D
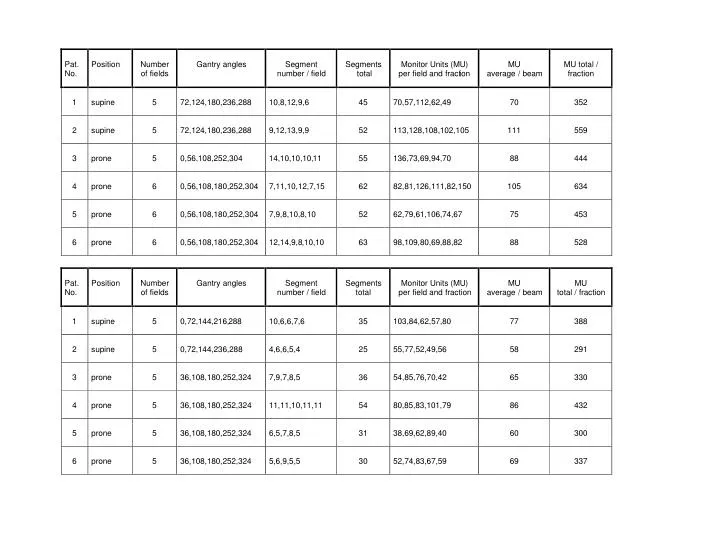
Pat. Position Number Gantry angles Segment Segments Monitor Units (MU) MU MU total / No. of fields number / field total per field and fract ion average / beam fraction 1 supine 5 72,124,180,236,288 10,8,12,9,6 45 70,57,112,62,49 70 352 2 supine 5 72,124,180,236,288 9,12,13,9,9 52 113,128,108,102,105 111 559 3 prone 5 0,56,108,252,304 14,10,10,10, 11 55 136,73,69,94,70 88 444 4 prone 6 0,56,108,180,252,304 7,11,10,12,7,15 62 82,81,126,111,82,150 105 634 5 prone 6 0,56,108,180,252,304 7,9,8,10,8,10 52 62,79,61,106,74,67 75 453 6 prone 6 0,56,108,180,252,304 12,14,9,8 ,10,10 63 98,109,80,69,88,82 88 528 Pat. Position Number Gantry angles Segment Segments Monitor Units (MU) MU MU No. of fields number / field total per field and fraction average / beam total / fraction 1 supine 5 0,72,144,216, 288 10,6,6,7,6 35 103,84,62,57,80 77 388 2 supine 5 0,72,144,236,288 4,6,6,5,4 25 55,77,52,49,56 58 291 3 prone 5 36,108,180,252,324 7,9,7,8,5 36 54,85,76,70,42 65 330 4 prone 5 36,108,180,252,324 11,11,10,11,11 54 80 ,85,83,101,79 86 432 5 prone 5 36,108,180,252,324 6,5,7,8,5 31 38,69,62,89,40 60 300 6 prone 5 36,108,180,252,324 5,6,9,5,5 30 52,74,83,67,59 69 337