Download
1 / 60
600 likes | 618 Views
Explore the history and evolution of visualization methods from the 15th century to the present, emphasizing the use of computer-supported interactive visuals to enhance cognition. Learn about scientific visualization, virtual environments, and the role of visual thinking in scientific breakthroughs. Discover practical steps for data transformation, visual representation, and delivery using tools like Paraview and Excel. Gain insights into fundamental data types, pre-attentive processing, color usage, and design principles to create impactful visualizations.

E N D
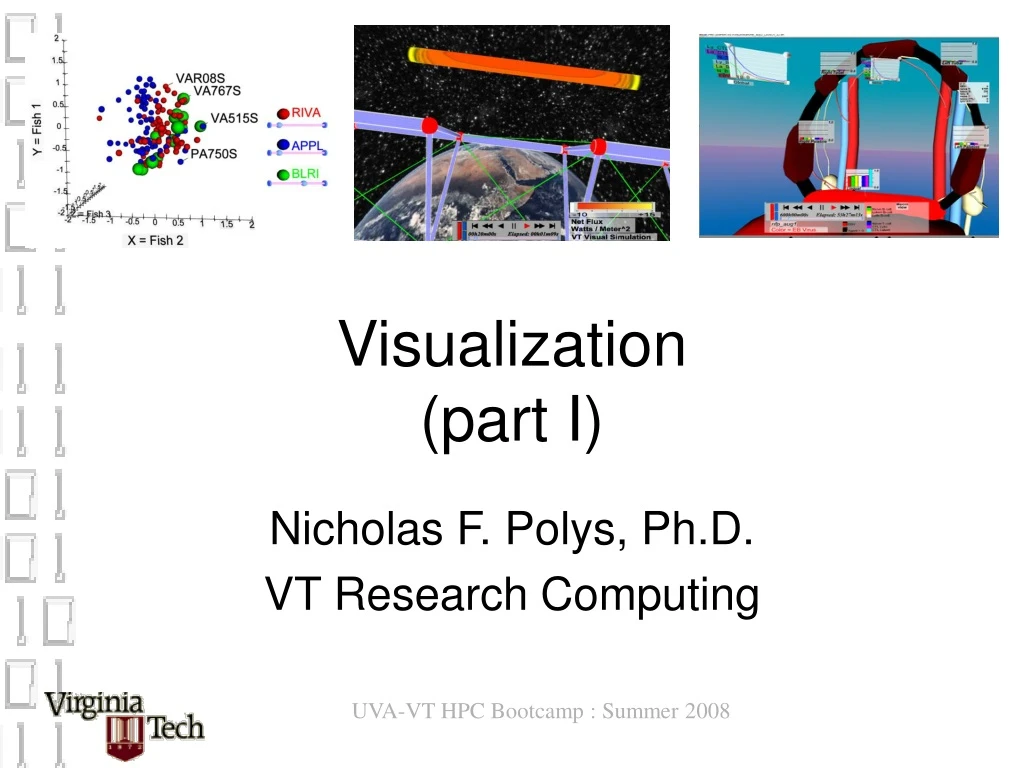
Visualization (part I) Nicholas F. Polys, Ph.D. VT Research Computing
Overview • Visual Analysis & Graphical Communication • Hands-on with Paraview and Vis-It • Tomorrow: Interactive 3D and script processing, VT Vis Lab visit
Scientific method, 15th-20th centuries theory = conceptual description of reality experiment = test theory in physical world
model = formal representation of reality simulation = behavior of model over time Scientific method, 1950-present
running together model = formal representation of reality simulation = behavior of model over time Scientific method, 1950-present
Scientific method, emerging 21st century Virtual environments can connect all models and simulations together Scientific method, emerging 21st century
Visualization & Graphical Communication • What is visualization? • Examples • Pop-out effects (pre-attention) • Color usage • Design Gotchas • Production Gotchas
Visualization: definition • Generally: • The use of computer-supported, interactive, visual representations of data to amplify cognition Card, McKinlay and Schneiderman • Scientific Visualization • Information Visualization • Virtual Environments
Visual Analysis Overview User Raw data Tables Visual structures Views Data transforms | Visual attribute | View transforms | Rendering assignment Figure 2.1: Processing in a typical visualization pipeline (from Card et al, 1999)
Visual Thinking • Many of the great scientists were good at visual thinking: • Leonardo da Vinci • James Clerk Maxwell • Michael Faraday • Albert Einstein • This was often at the expense of verbal skills • Tom West : “In the Mind’s Eye” • See also http://www.krasnow.gmu.edu/twest/maxwell_visual.html Maxwell’s clay model now in New Cavendish Laboratory, Cambridge (picture by Tom West)
Visual Analysis Overview User Raw data Tables Visual structures Views Data transforms | Visual attribute | View transforms | Rendering assignment Figure 2.1: Processing in a typical visualization pipeline (from Card et al, 1999)
First Steps Extract data and Map • Data transformation • Raw data -> attributes of interest • File formats or scripts are usually employed • Visual attributes • Assign attributes -> visual representation • Typically use some tool (e.g. Paraview, Excel, Gnuplot)
Second Steps Publish and Deliver • View transformation • ‘Camera’ location and properties • Rendering assignment • Print vs. interactive • Resolution, size • Stereo, immersion
Rewind- to first principles • The human mind is still the best analyst; how do we: • discover trends and relationships • communicate concept and results graphically • How can perception inform design?
Fundamental Data Types • Spatial / perceptual data: geometry, colors, textures, lighting • Abstract data / world & object attributes: nominal, ordinal, quantitative • Temporal data / behaviors: states, dynamics
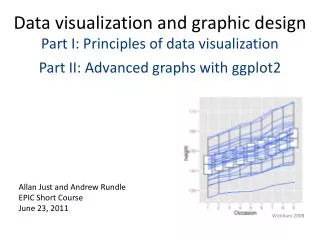
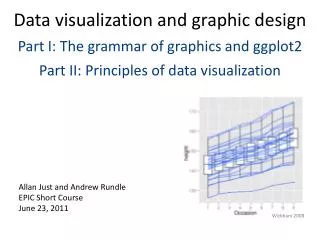
Which state has highest income? • Relationship between income and education? • Outliers?
College Degree % Per Capita Income
Pre-attentive Processing • Involuntary, do not require conscious attention • Parallel • Efficient • Resistant to instruction
Attention • Pop out effects ‘stand out’ in some simple dimension (conjunctions don’t): • Rapid visual search • Form, color, simple motion/blinking, spatial stereo depth, shading, position 12987621909023748594329087065483940560248595437289009890509874632234
Features: Color • Luminance channel (3x spatial accuity) • Red / Green channel • Yellow / Blue channel The rainbow spectrum is not a perceptually linear sequence (not pre-attentive)! (Keller 1993; Ware, 2000)
Color: • Pop-out or Categorical variables OK; • Ordinal is poor with Rainbow scale • Quantitative reading is poor in general;
Color (again) • IBM Research and color maps: http://www.research.ibm.com/dx/proceedings/pravda/truevis.htm • Human factors in visualization research Tory, M.; Moller, T.; Visualization and Computer Graphics, IEEE Transactions on Volume 10, Issue 1, Jan-Feb 2004 Page(s):72 - 84 http://doi.ieeecomputersociety.org/10.1109/TVCG.2004.1260759 • Color Spectra and Scales http://geography.uoregon.edu/datagraphics/EOS/Light&Bartlein_EOS2004.pdf • Some guidelines for Sci Vis: http://www-ugrad.cs.colorado.edu/~csci4576/SciVis/SciVisColor.html#ColorGuidelines • More detail about CG color models http://www.ncsu.edu/scivis/lessons/colormodels/color_models2.html
Representing multiple properties • Flow of air around a car • Vectors and particle paths illustrate flow • Coloured slice indicates pressure
Which network is easier to understand? See Graph Vis !
Image Production Bad printouts reflect poor attention to detail! • Screen images are at 72 dpi • For print: • Color images look clear at 300 dpi • Grayscale images look clear at 600 dpi • Bottom line: size and/or resolve your images accordingly (before using in doc / latex)
Movie Production • Movie size, framerate, and color pallette determine movie size • Watch out for flicker – incurs cognitive load! • Watch out for interpolation vs sequencing – incurs erroneous assumptions!
Frame Rate • Threshold for perceiving continuity: • flicker < 50 Hz • > 24 fps looks smooth & plenty interactive • Flicker & Attention can lead to change blindness (Simmons, 2000)
Attention and blindness • http://www.psych.ubc.ca/~rensink/flicker/ • http://www.psych.ubc.ca/~rensink/flicker/download/index.html • http://viscog.beckman.uiuc.edu/djs_lab/demos.html
What is HCI? • A multidisciplinary science of the interface: psychology, design & media, human factors, sociology, computer science • Experimental methods to rationalize UI features, design, and software architecture
Norman’s Gulfs Don Norman, 1986
Communication Across the Gulfs User-centered design: • Evaluation : Information Design • What do I see? • What does it mean? • Execution : Interaction Design • What is my next goal? • How do I achieve it? • Make it happen!
Information Design Goal: identify methods for representing and arranging the objects and actions possible in a system in a way that facilitates perception and understanding
Information Design • Define and arrange the visual (and other modality) elements of a user interface • Screen layout, icon design, vocabulary selection • But also the “big picture” or overall info model • Models of perception, psychology guide this • Engineering an information design • Make sure what people see (hear, etc.) makes sense, and helps them to pursue meaningful goals • Depends on what they are doing, hence the important role of user interaction scenarios
Background:Information Psychophysics • Edward Tufte, Envisioning Information (1983, 1990) • Jaques Bertin, Semiology of Graphics (1983) • Donald Norman, Cognitive Engineering (1986) • Joseph Goguen, Semiotic Morphisms (2000) • Colin Ware, Perception for Design (2003)
Making Sense of an Information Display Interpretation Excel worksheet, a cell is selected, formula is displayed at top Making Sense Perception Income worksheet, Total tax income is being calculated, the wrong multipler is being used color, shading, lines characters, squares, spatial organization Last month’s budget... ?
Good Graphics • Precision • Clarity • Maximize Data-to-ink ratio • Data Ink Ratio = (data ink) / (total ink in the plot) • Minimize Lie factor • Lie factor = (size of graphic) / (size of data)
Perception for Design • Using our understanding of the human perceptual systems to guide design • Visual system • Auditory system • Vestibular system • Leverage pre-attentive facilities • Reduce cognitive overhead
Perception • Organize and encode sensory data in the mind • Lines, shapes, colors are “extracted” • Very fast, generally with no conscious thought • May be influenced by expectations, “top-down” • Low-level units then grouped and organized • Perceived as rows, columns, grids, figures • Seeing the relationships among different elements • Design goal: make this perceptual process rapid and accurate
Making Sense of an Information Display Interpretation Excel worksheet, a cell is selected, formula is displayed at top Making Sense Perception Income worksheet, Total tax income is being calculated, the wrong multipler is being used color, shading, lines characters, squares, spatial organization Last month’s budget... ?