Download

1 / 16
160 likes | 174 Views
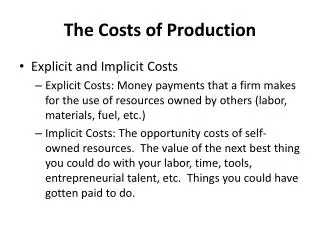
Costs of Production. Exam Question 2009 Q 3. Explain the shape of the SRAC curve. Explain the relationship between MCC and ACC. Downward sloping from x to y. 1. Specialisation As more products are made workers become more experienced and efficient. They can make more products per hour.

E N D
Exam Question 2009 Q 3 • Explain the shape of the SRAC curve. • Explain the relationship between MCC and ACC
Downward sloping from x to y 1. Specialisation • As more products are made workers become more experienced and efficient. • They can make more products per hour. • As a result unit costs are lowered. • “Many hands make light work”
2. Fixed Costs spread out over larger output • As the number of units produced increases the unit cost falls.
Upward sloping from y to z The Law of Diminishing Marginal Returns • As extra units of a variable factor of production (eg. labour) are added to a fixed factor (eg. factory) then eventually the average output will decrease.
This will result in higher unit costs. • Eg. 10 workers make 10 product each • 100 workers make 9 products each Because the cannot work properly due to overcrowding. “Too many cooks spoil the broth.”
Relationship between MC & SR AC • When MC > AC then AC is rising • When MC < AC then AC is falling • When MC = AC then AC is at it’s min
LRAC slopes downward because • Economies of Scale • Internal Economies of Scale • Are those factors within the firm which decreases AC as the size of the firm increases. • External Economies of Scale • Are those forces outside the firm which decreases AC as the size of the industry increases.