Download
1 / 33
330 likes | 549 Views
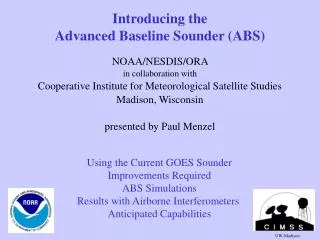
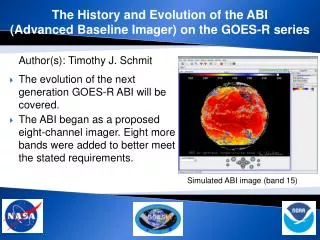
The Advanced Baseline Imager (ABI). Timothy J. Schmit NOAA/NESDIS/STAR (formerly ORA) SaTellite Applications and Research (STAR) Advanced Satellite Products Team (ASPT) in collaboration with the Cooperative Institute for Meteorological Satellite Studies (CIMSS) Madison, WI.

E N D
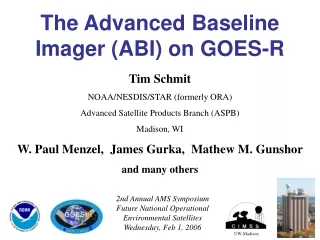
The Advanced Baseline Imager (ABI) Timothy J. Schmit NOAA/NESDIS/STAR (formerly ORA) SaTellite Applications and Research (STAR) Advanced Satellite Products Team (ASPT) in collaboration with the Cooperative Institute for Meteorological Satellite Studies (CIMSS) Madison, WI Satellite Direct Readout Users Conference for the Americas 12 December 2002 UW-Madison
Oceanographic Numerical Weather Prediction Weather Hydrology/ Land Surface Climate UW Natural Hazards Current GOES Imagers -- a wide variety of Applications
Limitations of Current GOES Imagers • Regional/Hemispheric scan conflicts • Low spatial resolution • Missing spectral bands • Eclipse and related outages
ABI Current Spatial resolution 0.64 mm Visible 0.5 km Approx. 1 km Other Visible 1.0 km n/a IR bands 2 km Approx. 4 km Spatial coverage Full disk 4 per hour Every 3 hours CONUS 12 per hour 4 per hour Operation during eclipse Yes No Spectral Coverage 15/16 bands 5 bands The Advance Baseline Imager:
Visible and near-IR channels on the ABI Cirrus Snow Part. size Clouds Veg. Haze
ABI Bands Current GOES Imagers MSG or Sounder MODIS or MTG, etc
ABI Bands Current GOES Imagers MSG or Sounder MODIS or MTG, etc
ABI Bands Current GOES Imagers MSG or Sounder MODIS or MTG, etc
MODIS 0.25 km Lake Effect Snow Bands: Visible MODIS 0.5 km MODIS 1 km 19 January 2001, 1720 UTC GOES-8 1 km
MODIS (1 km) ABI (2 km) Severe convection: IR windows 25 February 2001 GOES-8 (4 km) The simulated ABI clearly captures the over-shooting (cold) cloud tops, while the current GOES Imager does not. Images shown in GOES projection.
Weighting Functions for the ABI IR Channels (For the standard atmosphere at a 40 degree Local Zenith Angle)
Mixed Cloud Thermodynamic Phase 21 April, 2001 at 1745 UTC ARM Southern Great Plains Site BTD[8.5-11] and BT[11] consistent with mixed ice and water phase clouds, supercooled water cloud, overlapped clouds Kansas Oklahoma Nasiri, Frey, Baum -- IR Cloud Thermodynamic Phase
Volcanic Ash Plume: 11-12 and 8.5-11 μm images UW/CIMSS One day after the Mt. Cleveland eruption 20 February 2001, 0845 UTC Simulated ABI (11-12 μm) Simulated ABI (8.5-11 μm)
UW/CIMSS GOES Sounder Ozone and Turbulence
GOES-R and GOES-I/M Simulations of Viejas Fire Using MODIS Data: January 3, 2001 at 1900 UTC Simulated GOES-R: 3.9 micron Simulated GOES-I/M: 3.9 micron GOES-R: 3.9 micron brightness temperatures GOES-I/M: 3.9 micron brightness temperatures GOES-R will allow for improved characterization of fire dynamics
GOES WFABBA Monitors Rapid Intensification of Wildfires Arizona Smoke Rodeo Rodeo Chediski Chediski 21:15 UTC 18:15 UTC 20 June 2002 16:15 UTC Quebec QUEBEC ONTARIO ONTARIO QUEBEC 6 July 2002 11:45 UTC 17:45 UTC
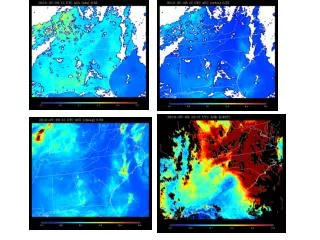
ABI (3.9 m)Based on GOES Imager Ch 2useful for fog, snow, cloud, and fire detection 5 March 2001 - Nocturnal Fog/Stratus Over the Northern Plains GOES-10 4 minus 11 μm Difference ABI 4 minus 11 μm Difference Both images are shown in the GOES projection. Fog UW/CIMSS ABI image (from MODIS) shows greater detail in structure of fog.
Utility of the 0.86mband • Helps in determining vegetation amount, aerosols and for ocean/land studies. • Enables localized vegetation stress monitoring, fire danger monitoring, and albedo retrieval. • Provides synergy with the AVHRR/3. SCARB_0.85um
Burn Scars Scars (dark regions) caused by biomass burning in early September are evident in MODIS 250 m NIR channel 2 (0.85 μm) imagery on the 17th. MODIS Data from GSFC DAAC MODIS Detects Burn Scars in Louisiana 01 September 2000-- Pre-burning 17 September 2000-- Post-burning ABI will allow for diurnal characterizations of burn areas, this has implications for re-growth patterns. CIMSS, UW
ABI spatial coverage rate versus the current GOES Imager ABI coverage in 5 minutes GOES coverage in 5 minutes The anticipated schedule for ABI will be full disk images every 15 minutes plus CONUS images every 5 minutes.
Only the GOES perspective gives the needed time continuity Special ~5-minute (infrared window) imagery from GOES-11 during the IHOP field experiment: Click on figure to start loop
Current GOES perspective limits data for full disks 3-hourly (infrared window) imagery from GOES-11 during the IHOP field experiment: Click on figure to start loop
Satellite-derived winds Satellite-derived winds will be improved with the ABI due to: - higher spatial resolution (better edge detection) - more frequent images (offers different time intervals) - better cloud height detection (with multiple bands) - new bands may allow new wind products (1.38 m?) - better NEdT’s - better navigation/registration
Linden_haze_0.439_to_0.498um (ABI spectral band from AVIRIS) Smoke
Linden_vegetation_0.831 _to _0.889 Vegetation
Linden_shadow_1.581_1.640um Shadow
Summary -- ABI • ABI addresses NWS Imager concerns by: • increasing spatial resolution • - closer to NWS goal of 0.5 km IR • scanning faster • - temporal sampling improved • - more regions scanned • adding bands • - new and/or improved products enabled • Simulations (from MODIS and AVIRIS) show that the ABI addresses NWS requirements for improved cloud, moisture, and surface products. • Every product that is being produced from the current GOES imager will be improved with data from the ABI! • Plus, ABI will allow exciting new products from geostationary orbit.
More information can be found at • http://cimss.ssec.wisc.edu/goes/abi/ • http://ams.confex.com/ams/pdfview.cgi?username=54285 • http://cimss.ssec.wisc.edu/modis1/modis1.html • http://rapidfire.sci.gsfc.nasa.gov/ • http://cimss.ssec.wisc.edu/goes/goes.html • GOES Gallery • Biomass Burning • http://www2.ncdc.noaa.gov/docs/klm/html/c3/sec3-0.htm • NOAA KLM User's Guide • http://www.eumetsat.de/en/ • MSG..System..MSG..Payload..Spectral bands..Spectral bands