Download
1 / 19
190 likes | 209 Views
Engage in graphing exercises, explore data placement in quadrants, calculate shape perimeters. Conduct binder checks, review previous tasks, and plan for class growth projections. Excel for demonstrating growth scenarios.

E N D
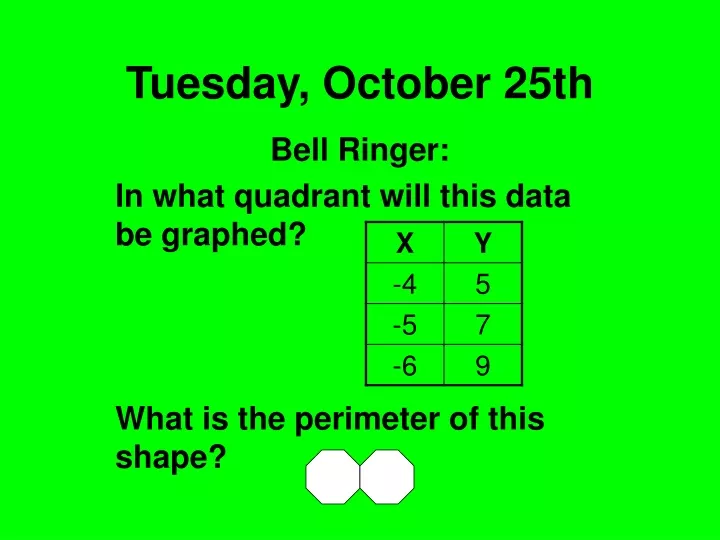
Tuesday, October 25th Bell Ringer: In what quadrant will this data be graphed? What is the perimeter of this shape?
Bell Ringer Review Bell Ringer: In what quadrant will this data be graphed? What is the perimeter of this shape?
Yesterday there were binder checks Period 1: • Jessica Olivares -Menijah Stokes • Michael Dye • Darius Mitchell • Ramon Moreno • Angel Sanchez
Yesterday there were binder checks Period 3: • Vanessa Salinas • Jeremiah Cisneros • Idalia Colon • Michelle Rodriguez • Uriel Salgado • Elaine Vargas • Stephon Walker
Yesterday there were binder checks Period 6: • Tavaras Clark • Keishawn Jefferies • Jasmine Kemp
Yesterday there were binder checks Period 7: • Diana Mora • Jesus Perez • Nicholas Woods
Yesterday there were binder checks Period 8: • Ashanti Holiday • Latasha Nelson • Martha Rivera
Today Objective: I CAN graph data sets
Class Mastery Has this class gotten much smarter?
Class Mastery Has this class gotten much smarter?
Class Mastery Has this class gotten much smarter?
When Graphing • Independent variable goes on the X axis • Dependent variable goes on the y axis • Use Scale: • Using a small scale can make changes look large • Using a large scale can make changes seem small • Every line must represent the same amount
Your Job Make a presentation to Mr. McNeal
Make three graphs • One that makes it appear as if Bogan is not growing very much • One that makes it seem as if Bogan is growing like crazy • One that is neutral and presents a correct picture of Bogan’s Growth.
Let’s talk about it • USE EXCEL TO HAVE EACH GROUP TALK ABOUT IT • What did you do to… • Make it appear neutral • Make it appear high? • Make it appear low?