Download
1 / 27
270 likes | 365 Views
The Transportation Funding Gap. This is what you have heard. Twenty Year Funding Needs to Achieve Desired Outcomes ($ billions). Twenty Year Funding Needs to Achieve Desired Outcomes (20 Year Needs in $ billions) AFG = Annual Funding Gap.

E N D
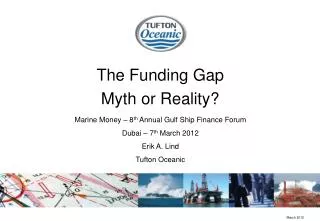
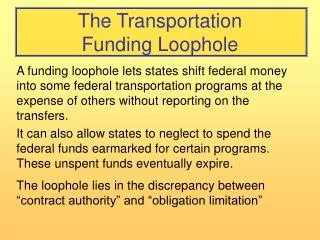
The Transportation Funding Gap This is what you have heard.
Twenty Year Funding Needs to Achieve Desired Outcomes($ billions)
Twenty Year Funding Needs to Achieve Desired Outcomes(20 Year Needs in $ billions) AFG = Annual Funding Gap
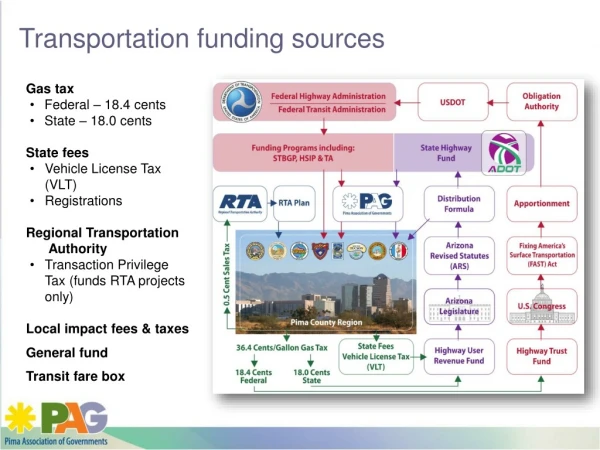
An Illustration of Various Transportation Funding Mechanisms and Projected Revenue Generating Capacity
Anticipated Outcomes for Status Quo Scenario: State Highways • Interstates maintained at MAP-21 target • Principal arterials become 16% poor (1,300 miles) • Minor arterials become 42% poor (2,800 miles) by 2032 • Bridge condition is well under performance targets with 76% of bridges in good or satisfactory condition and 20% of bridges (647 bridges) in poor condition • Safety investments remain at current levels, traffic fatalities continue to decline • Metro congestion increases and reliability decreases systemwide, reliability and throughput increase at spot locations • Inter-regional corridors have limited delays, performance on a handful of major corridors continues to decline • Little money available for expansion, regional and local priorities, economic development, etc
Anticipated Outcomes for Maintaining Current Performance Scenario: State Highways • Interstates maintained at MAP-21 target • Principal arterials become 6% poor by 2032 (454 miles) • Minor arterials become 11% poor by 2032 (741 miles) • Bridges at or near current performance targets • Traffic fatalities continue to decrease • Metro congestion increases slightly systemwide, reliability improves on future MnPASS corridors and at congestion management and safety HROI project locations • IRCs continue to meet performance target • Modest amount available for expansion, regional and local priorities, economic development, etc
World Class/Economically Competitive System Scenario: State Highways • Interstates maintained at MAP-21 target • Principal arterials improve to less than 2% poor by 2032 (151 miles in poor condition) • Minor arterials improve to less than 3% poor by 2032 (202 miles in poor condition) • Bridge conditions meet targets of less than 2% poor and greater than 84% good and satisfactory • Safety investments remain at current levels, MnDOT meets Toward Zero Deaths fatality targets in future years • With capacity investments, metro congestion remains stable, reliability improves on MnPASS corridors and at HROI locations • Modest amount available for expansion, regional and local priorities, economic development, etc
Greater Minnesota Transit Anticipated Outcomes • Maintaining current performance • Annual hours of service remain at projected 2013 level of 1.23 million hours • Some revenue is reserved from 2013 to 2022, then spent to maintain service as inflationary costs exceed revenue • Economically competitive/World class • Minnesota Statutes §174.24 • Meet 80% of transit needs by July 1, 2015 • Meet 90% of transit needs by July 1, 2025
Freight RailAnticipated Outcomes • Rail Grade Crossing Improvement • Public cost share is 25% • Performance goal of 50% crossings with gates & signals = 2250 of 4500 crossings vs. 1500 (33%) currently • Assumes $250K per crossing for gates & signals • Assumes useful life of signal system is 25 years • Selected needs as identified in 2010 MN Statewide Rail Plan. • Statewide short line railroad track and structure upgrades to handle Class 1 286,000 lb. rail cars • Economic development projects include rail-served business parks, intermodal container, transload, etc
Ports and Waterways Anticipated Outcomes • Port upgrades include reconstructing dock walls, warehouse rehabilitation, improving road and rail access, limited dredging, loading equipment, etc. • Appropriations over past five years have totaled $7.5 million = $1.5 million/year • Assumes twenty year needs of $90 million based on average annual needs as identified by the state’s port authorities
Statewide AirportAnticipated Outcomes • Current System Maintained • Eliminates runway and taxiway extensions • No new airports • Funding priorities: safety, mobility, financial, operations, preservation • No new navigation (NextGEN) deployment • Economically Competitive/World Class
Passenger Rail Anticipated Outcomes • Full build out of Phase 1 projects as a statewide system over twenty-year timeframe: • Twin Cities to Chicago -110 mph service • Twin Cities to Duluth -110 mph service • Twin Cities to Rochester -150 plus mph service • Twin Cities to St. Cloud, Moorhead -up to 90mph service • Twin Cities to Mankato -up to 90mph service • Twin Cities to Eau Claire -up to 90 mph service • 20-year capital cost estimate $4B - $5.1B for priority passenger and share freight rail improvements if built as a system, built as a series of individual unrelated projects the 20-yr. estimate is $4.5B - $5.7B. • Outcomes: • Between 4.1 to 6 million annual riders. • Annual operating subsidies of $41m - $95m are based on a farebox recovery of approximately 71% -49%. • Shared freight and passenger rail improvements • Best case scenario in terms of operations cost • Interstate/intrastate Pass. rail connection to economic centers • 2009 $26m in State G.O. Bonds • Phase 1 State Rail Plan projects implemented
Metropolitan Area Transit Scenario 1 – Status Quo • Continue to operate the transit system that exists today and finish Central LRT and Cedar Stage 1 • System includes: • Existing bus and Metro Mobility service levels • Mandatory Metro Mobility (ADA) service increases • Hiawatha LRT • Northstar Commuter Rail • Central LRT starting in 2014 • Cedar Ave BRT Stage 1 starting in 2013
Metropolitan Area Transit Anticipated Outcomes for Status Quo Scenario • Increased fares • Reduced service • Reduced ridership • Does not address growing demand • Service quality and customer satisfaction reduced
Metropolitan Area Transit Scenario 2 – Maintain Current Performance • Regional growth requires more transit investments to maintain current mobility levels • System includes: • Scenario 1 service levels • Bus service expansion (0.5% growth / year) • Southwest LRT (SWLRT) • I-35W South BRT • Cedar Ave BRT Stage 2 • Three Arterial BRT corridors
Metropolitan Area Transit Anticipated Outcomes for Maintaining Performance Scenario Expected Outcomes: • Positive results for residents • Addresses growing transit demand and makes progress toward doubling ridership by 2030 • New connections between home, school, work and entertainment • Positive results for businesses • Transit spurs economic development • Solid infrastructure attracts jobs & development
Metropolitan Area TransitScenario 3 – Economic Competitiveness • Improved mobility levels for residents and businesses and enhanced regional economic competitiveness • System includes (conceptual example): • Scenario 1 and 2 service levels • Bus service expansion (1.0% total growth/year over status quo) • Two additional LRT (after SWLRT) • Six additional Arterial BRT corridors • Three additional Highway BRT/Managed Lane corridorsScenario 3 based on the transit vision in the Council's 2030 Transportation Policy Plan and the Program of Projects
Metropolitan Area Transit Anticipated Outcomes for Economic Competitiveness Scenario • Positive results for residents • Addresses more growth in demand and doubling of ridership by 2030 • Significantly better connections between home, school, work and entertainment • Faster, cheaper transportation options that are safe and environmentally-friendly • Positive results for business • Additional 500,000 employees will have access to jobs via transit • Freight and logistics savings • Investments compete well with similar investments in peer regions • Positive result for all taxpayers: A return on investment (ROI) between $6.6 and $10.1 billion to 2030
Metropolitan Area TransitScenario 4 – World Class • Accelerated transit investment program, sustained beyond 2030 • A more robust, balanced and comprehensive regional transit system • System includes (conceptual example): • Scenario 1, 2, and 3 service levels • Bus service expansion (1.5% total growth/year over status quo) • Three additional Arterial BRT corridors • Two additional rail lines • Two additional Highway BRT/Managed Lane corridors • Six streetcar lines
Metropolitan Area Transit Anticipated Outcomes for World Class Scenario • Positive results for residents • Significantly address growth in demand and more than double ridership by 2030 • Extensive connections between home, school, work and entertainment • Additional faster, cheaper transportation options that are safe and environmentally-friendly • Positive results for business • Additional employees will have access to jobs via transit • Additional freight and logistics savings • Position the region to surpass investments in peer regions and further enhance regional competitiveness • Positive result for all taxpayers: an ROI between $10.7 and $16.5 billion in 2030
Metropolitan Area Transit Summary • Scenario 1: results in service cuts and less mobility and leaves this region falling behind peers and losing competitiveness • Scenario 2: brings the region in line with existing conditions of competing peer regions • Scenarios 3 and 4: make the region competitive with peers and provide opportunities to attract additional investment