Download
1 / 56
560 likes | 570 Views
Use a graphing utility to create a scatter plot of mileage data for a car at various speeds. Use regression analysis to find the best-fit quadratic model and predict the speed that gives the greatest mileage.

E N D
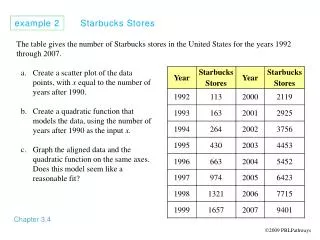
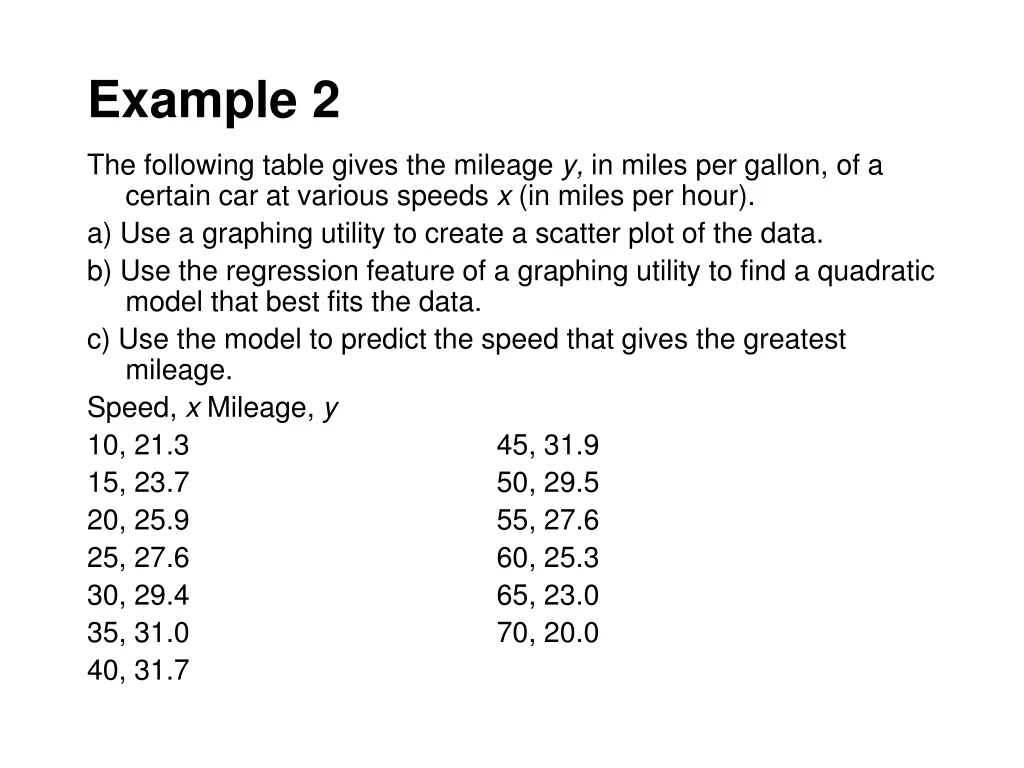
Example 2 The following table gives the mileage y, in miles per gallon, of a certain car at various speeds x (in miles per hour). a) Use a graphing utility to create a scatter plot of the data. b) Use the regression feature of a graphing utility to find a quadratic model that best fits the data. c) Use the model to predict the speed that gives the greatest mileage. Speed, x Mileage, y 10, 21.3 45, 31.9 15, 23.7 50, 29.5 20, 25.9 55, 27.6 25, 27.6 60, 25.3 30, 29.4 65, 23.0 35, 31.0 70, 20.0 40, 31.7
Example 2 The following table gives the mileage y, in miles per gallon, of a certain car at various speeds x (in miles per hour). a) Use a graphing utility to create a scatter plot of the data. b) Use the regression feature of a graphing utility to find a quadratic model that best fits the data. c) Use the model to predict the speed that gives the greatest mileage. Speed, x Mileage, y 10, 21.3 45, 31.9 15, 23.7 50, 29.5 20, 25.9 55, 27.6 25, 27.6 60, 25.3 30, 29.4 65, 23.0 35, 31.0 70, 20.0 40, 31.7
Example 3 For the data points below, determine whether a linear model or a quadratic model best fits the data. (1, 5) (2, 6) (3, 8) (4, 9) (5, 11) (6, 10) (7, 11) (8, 12) (9, 14) (10, 16)
Example 3 For the data points below, determine whether a linear model or a quadratic model best fits the data. (1, 5) (2, 6) (3, 8) (4, 9) (5, 11) (6, 10) (7, 11) (8, 12) (9, 14) (10, 16)
#1 Sketch the graph of by hand and identify the vertex and the intercepts.
#2 Find the number of units that produce a minimum cost C if
#3 Find the quadratic function that has a maximum at (1, 7)and passes through the point (2, 5).
#4 Find two quadratic functions that have x-intercepts (2,0) and
#5 Use the leading Coefficient Test to determine the right-hand and left-hand behavior of the graph of the polynomial function
#6 Find all the real zeros of Verify your answer with a graphing utility.
#7 Find a polynomial function with 0, 3, and -2 as zeros.
#8 Sketch by hand.
#9 Divide by x - 3 using long division.
#10 Divide by
#11 Use synthetic division to divide by x + 5.
#12 Use synthetic division to find f(-6)when
#13 Find the real zeros of
#14 Find the real zeros of
#15 List all possible rational zeros of the function
#16 Write as a product of linear factors.
#17 Write in standard form.
#18 Write in standard form.
#19 Find a polynomial with real coefficients that has 2, 3 + i, and 3 -2i as zeros.
#20 Use synthetic division to show that 3i is a zero of
#21 Sketch the graph of and label all intercepts and asymptotes.
#22 Sketch the graph of and label all intercepts and asymptotes.
#23 Find all the asymptotes of