Download
1 / 23
230 likes | 343 Views
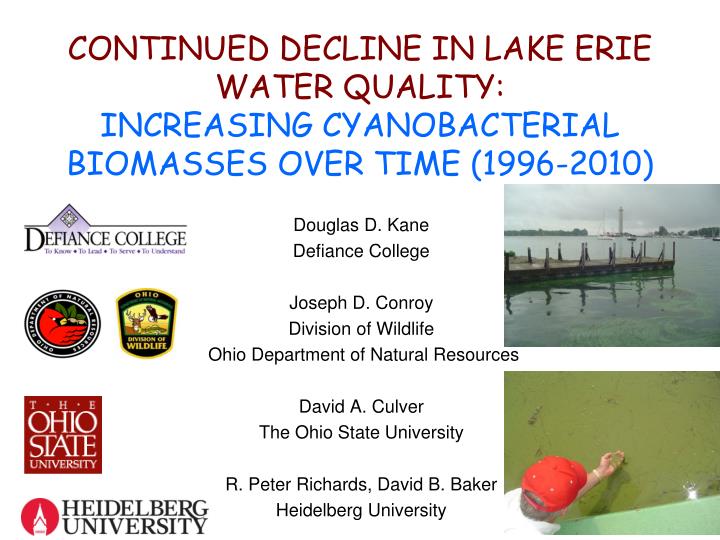
CONTINUED DECLINE IN LAKE ERIE WATER QUALITY: INCREASING CYANOBACTERIAL BIOMASSES OVER TIME (1996-2010). Douglas D. Kane Defiance College Joseph D. Conroy Division of Wildlife Ohio Department of Natural Resources David A. Culver The Ohio State University

E N D
CONTINUED DECLINE IN LAKE ERIE WATER QUALITY: INCREASING CYANOBACTERIAL BIOMASSES OVER TIME (1996-2010) Douglas D. Kane Defiance College Joseph D. Conroy Division of Wildlife Ohio Department of Natural Resources David A. Culver The Ohio State University R. Peter Richards, David B. Baker Heidelberg University
The Overarching Issue Lake Erie is impaired due to excessive loadings of sediment and nutrients. Long-term water quality monitoring has identified the Maumee River as being the largest single contributor of non-point source pollution to the lake. From- WLEB Partnership Website
Recent Lake Erie Re-Eutrophication • TRENDS (1970’s- 2000’s) • Total Phosphorus Loading • Phytoplankton Biomass- WB • Cyanobacterial Biomass- WB
Observations • Total Phosphorus Loading not increasing, but • Phytoplankton, Cyanobacterial blooms • Soluble Reactive Phosphorus Loading • And, • Dreissenid mussels now in the system • Mayflies have returned • Changing climate (i.e. more large storm events, warmer winters etc.)
Hypothesis • Soluble Reactive Phosphorus Loading LEADS TO • Phytoplankton, Cyanobacterial blooms
Methods • SRP Load Determinations: NCWQR, HU • Phytoplankton Biomass Determinations: LL, OSU • Regression Analysis: • Total PP/ Cyanobacterial Biomass vs. SRP • Cyanobacterial Biomass vs. Time
Results- Median Cyanobacterial Biomass vs. Corrected SRP Load (1996-2006) P < 0.001 r2 = 0.80
Results- Seasonal Average Biomass vs. Uncorrected SRP Load (1996-2006) P = 0.008 r2 = 0.56 P = 0.008 r2 = 0.56
Results- Seasonal Average Biomass vs.Uncorrected SRP Load (1996-2006) P = 0.007 r2 = 0.57 P = 0.008 r2 = 0.56
Results- Seasonal Average Biomass (no >95% values) vs.Time (1996-2011) P = 0.006 r2 = 0.46 P = 0.002 r2 = 0.55
Conclusions September 2011 Western Lake Erie Waterkeeper Association NASA October 2011 NASA
Reasons for SRP Increase?? • DWWTP (Detroit Wastewater Treatment Plant) • CSOs (Combined Sewer Overflows) • CAFOs (Concentrated Animal Feeding Operations) • UFOs (Unidentified Fertilizing Objects) • Timing of Fertilizer Application • Rate “ “ • Type “ “ • Amount “ “ • Exurbanization • Septic Systems • Saturated Filter Strips • Climate Change • All of These • None of These
Acknowledgements • Dave Dolan- UWGB- Total Phosphorus Loading Data • Limnology Laboratory Personnel- OSU • National Center for Water Quality Research Personnel- HU