Download
1 / 4
40 likes | 141 Views
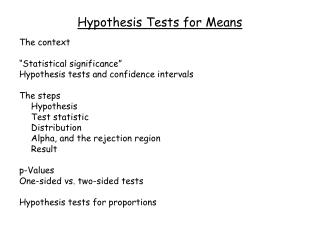
Unit 10: Hypothesis Tests. Effect of sample size. Valesky vs. Brown: Both surveys below say 54% for V., so for CI, EV of sample % is .54. And for sig test: H 0 : p = 0.5, H a : p > 0.5.

E N D
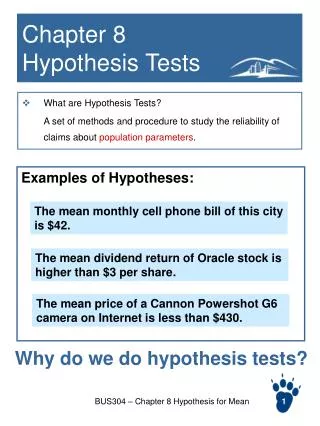
Effect of sample size • Valesky vs. Brown: Both surveys below say 54% for V., so for CI, EV of sample % is .54. And for sig test: H0: p = 0.5, Ha: p > 0.5. • n = 100: For CI, SE = √[.54(.46)/100] = .05, so 54% ± 10%. For sig test, SE = √[.5(.5)/100] = .05, so P(% ≥ .54) = P(z ≥ (.54-.5)/.05 = .8) = 21% • n = 1600: For CI, SE = √[.54(.46)/1600] = .0125, so 54% ± 2.5%. For sig test, SE = √[.5(.5)/1600] = .0125, so P(% ≥ .54) = P(z ≥ (.54-.5)/.0125 = 3.2) = .07%
Sgn test: Are x,y really related? • Regression line for data in sample approximates the regr line for population: y = α + βx , where α, β are the intercept and slope for the population. • Are population x,y really related, i.e., is β ≠ 0? • Sgn test: H0: β = 0, t = √[n-2]∙r/√[1-r2], df = n-2 • Some statisticians, like our authors, disapprove of this test. (SigT4Slope.ods)
Example: H0: β = 0 t = √[4-2] (.434)/ √[1-(.434)2] ≈ .681 , df = 4-2 = 2 P(t ≥ .681 or ≤ -.681) is not less than 5%, so we fail to reject the null hypothesis: x and y are not related.