Download
1 / 57
1.4k likes | 3.46k Views
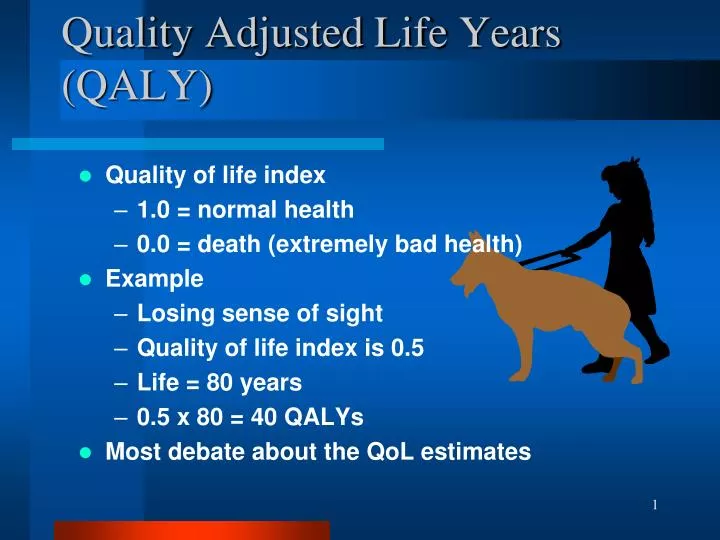
Quality Adjusted Life Years (QALY). Quality of life index 1.0 = normal health 0.0 = death (extremely bad health) Example Losing sense of sight Quality of life index is 0.5 Life = 80 years 0.5 x 80 = 40 QALYs Most debate about the QoL estimates. Quality of life measurement.

E N D
Quality Adjusted Life Years (QALY) • Quality of life index • 1.0 = normal health • 0.0 = death (extremely bad health) • Example • Losing sense of sight • Quality of life index is 0.5 • Life = 80 years • 0.5 x 80 = 40 QALYs • Most debate about the QoL estimates
Quality of life measurement • Typically done with questionnaires • Disease specific • International Prostate Symptom Score • Generic • SF-36, NHP • Utility • HUI, EQ-5D, AQoL, 15D, Rosser index • Utility assessment • SG, TTO, PTO, VAS • For QALY we need utility
MOBILITY • I have no problems in walking about • I have some problems in walking about • I am confined to bed • SELF-CARE • I have no problems with self-care • I have some problems washing or dressing myself • I am unable to wash or dress myself • USUAL ACTIVITIES (e.g. work, study, housework family or leisure activities) • I have no problems with performing my usual activities • I have some problems with performing my usual activities • I am unable to perform my usual activities • PAIN/DISCOMFORT • I have no pain or discomfort • I have moderate pain or discomfort • I have extreme pain or discomfort • ANXIETY/DEPRESSION • I am not anxious or depressed • I am moderately anxious or depressed • I am extremely anxious or depressed EuroQol EQ-5D:of the shelf QALY value
Calculate QALY • Count life years • Value (V) quality of life (Q) • V(Q) = [0..1] • 1 = Healthy • 0 = Dead • Adjusted life years (Y) for value quality of life • QALY = Y * V(Q) • Y: numbers of life years • Q: health state • V(Q): the quality of life value of health state Q
Which health care program is the most cost-effective? • A new wheelchair for elderly (iBOT) • Special post natal care
Which health care program is the most cost-effective? • A new wheelchair for elderly (iBOT) • Increases quality of life = 0.1 • 10 years benefit • Extra costs: $ 3,000 per life year • QALY = Y x V(Q) = 10 x 0.1 = 1 QALY • Costs are 10 x $3,000 = $30,000 • Cost/QALY = 30,000/QALY
Special postnatal care • Quality of life = 0.8 • 35 year • Costs are $250,000 • QALY = 35 x 0.8 = 28 QALY • Cost/QALY = 8,929/QALY
Disability Adjusted Life Years (DALYs) • DALYs for a disease are the sum of the years of life lost due to premature mortality (YLL) in the population and the years lost due to disability (YLD) for incident cases of the health condition. One DALY represents the loss of one year of equivalent full health.
Disability Adjusted Life Years (DALYs) • Measures healthy time lost from specific diseases and injuries in a population • Comparable and additive across diseases Ex: Broken scapula = .5 DALYs lost Protein deficiency = 2 DALYs lost • Based on relatively accessible incidence data (ICD codes)
DALY Calculation (the easiest way) Years lost to disability Inputs • Duration of disease/injury • Disability weight of disease/injury • % long-term cases Years of lost life (YLLs) Inputs Life expectancy at age of death Age at death
1 family dies 10 year old girl 8 year old boy 38 year old mother 42 year old father YLLs from deaths 70 year life expectancy 73 year life expectancy 46 year life expectancy 33 year life expectancy 222 YLLs 2 people injured 45 y/o woman – SCI 55 y/o man – fractured rib YLDs from injuries Duration (36 year LE) * Disability Wt (.725) = 26 YLDs Duration (.115 years) * Disability Wt (.199) = 0.02 YLDs DALY Calculation: an example A Two-Car Collision 248.02 DALYs + 26.02 YLDs =
Cost of Illness (COI) Analysis • Estimate the impact of a disease / condition on the overall costs • Include direct as well as indirect costs • Example:The overall costs for cancer in 2002 in the US was $171.6 billion (ACS, 2003), including • $60.9 billion in direct medical costs • $15.5 billion in indirect morbidity costs • $95.2 billion in indirect mortality costs
Budget Impact Analysis (BIA) • Estimate the financial effect of an intervention on a health plan or program • BIA is often requested by managed care organizations in the US or national health insurance programs (e.g., Canada, UK) • Example: Treating all stage IV NSCLC patients in Canada with paclitaxel and cisplatin as outpatients would cost $155 million, an additional $15 million per annum compared to best supportive care.
BIA (cont.) • Most BIA analysis has a one year time frame. • BIA taking a longer time frame need to consider the impact of new interventions on the underlying disease prevalence and make appropriate adjustments in analyses.
Uses dollar values for outcome measurements Maximizes benefit of investment/intervention Assumes limited resources Compares programs with different objectives Uses nonmonetary outcome measurements Minimizes cost of program Assumes adequate resources Compares programs with the same objectives CBA vs. CEA
Direct medical: medical care services Direct non-medical: Patient time cost for treatment or intervention Formal and informal caregiver time Transportation Productivity (morbidity and mortality) absenteeism Presenteeism Inclusion and measurement will depend on the study’s perspective and its time frame. Cost Categories
Inflation • Inflation is a sustained increase in the average level of prices. The rate of inflation is the percentage change in average prices from one year to the next • For prices that tend to increase at the rate of general prices (e.g., consumer goods), use the Consumer Price Index (CPI) • For items whose prices rise faster than the general rate of inflation, use a component of the CPI, such as the Medical Care component of CPI • For wages, use either an index of hourly wages or earnings
Example • Suppose you want to use information from a published manuscript that listed the cost of a severe adverse event of febrile neutropenia in 1983 dollars to be $1,531. How would you adjust that figure to current dollars? • Index: • 1983 (base year)=100 • 1998 = 242.7 • C(1998) = $1,531 * 242.7 / 100 = $3,716
Discounting • Many decisions made today will have repercussions next year and in the years thereafter. • We need a method for comparing the desirability of outcomes that include consequences occurring at different times in the future.
The Theory of Discounting • The theoretical justification for discounting is based on two facts: • time preference: most people would accept less money to receive it sooner; and • opportunity cost: less money can be invested by society and allowed to grow at a compound rate of interest to yield the money required for future costs.
Discounting Process • Given a stream of costs C1,C2, …, CT,the present value is calculated as: , where 1/(1+r) t is called the discount factor
Issues in Discounting • While there is universal acceptance of the need to discount, there is much controversy over • the appropriate discount rate to use, • whether to discount health benefits as well as costs, and • whether to use the same rate to discount costs and benefits.
Example • A comparison of Programs A and B, adjusted for the differential timing of costs would yield: • PVA = 5/(1.05) + 10/(1.05)2 + 15/(1.05)3 = 26.79 • PVB = 15/(1.05) + 10/(1.05)2 + 4/(1.05)3 = 26.81
Theoretical Foundation of CEA • Theoretical foundation of CEA was established by a landmark article by Garber & Phelps (1997). • Derive ICER in terms of 3-period U function • E(U) = U1(Y1-C1) + P2(C1)*U2(Y2-C2) + P2(C1)P3(C2)U3(Y3) , where Yi = income; Ci = medical care expenditure Pi = probability of surviving into period i
CEA and Welfare Economics • Use prob. of surviving as “effectiveness” measure • Incremental cost-effectiveness ratio can be derived from the F.O.C.: • Max. E(U) w.r.t. C1 • Decision criteria based on CEA is justified in welfare economics achieve optimal resource allocation
CEA Framework • Two treatments (trx): new (A) vs. old (B) • Costs: • Pts in the new trx group: Ca1, Ca2, ….CaK • Pts in the old trx group: Cb1, Cb2, ….CbJ • Effectiveness: • Examples of effectiveness measures: • Quality-adjusted life years (QALYs) • Life year saved • Pts in the new tx group: Ea1, Ea2, ….EaK • Pts in the old tx group: Eb1, Eb2, ….EbJ
Incremental Cost-Effectiveness Ratio (ICER) • Decision Rule: If IĈER < , then the new treatment is cost-effective Making inference about the true (but unobservable) population ICER
Making Decisions Using ICER • If the ICER doesn’t fall into the quadrant of dominating or dominating strategy, then decision makings based on CE-ratio become a bit tricky. • Rule 1: value judgement specified by an organization • $20,000 per QALY used in Ontario guidelines • Problems?
Making Decisions Using ICER (cont.) • Rule 2: comparison with the commonly used medical procedures. • Rationale: Society should be willing to pay as much for new procedures/technologies as it does for procedures that are currently in common use. League tables
Recent Advances in CEA - 1 • Estimate confidence interval of ICER • Statistical Methods: • Box method • Delta Method (Taylor Series Method) • Fieller Theorem Method • Nonparametric Bootstrap Method • ….
Problems with Inferences Based on ICER • Negative ratios are difficult to interpret • C.I. derived from CE ellipses only make sense when E > 0 Solution: Net Health Benefit approach
Recent Advances in CEA • Net Health Benefit Approach • NB() = E - C • Decision rule: Choose the new technology if NB()>0 • Methods developed from NHB: • Cost-Effectiveness Acceptability Curve • Bayesian Approach • Regression-based Approach
Ten Steps of Performing An Economic Evaluation Study • Establish the perspective • Describe or specify the alternatives • For each alternative, specify the possible outcomes and the probability of their occurrence • Specify and monitor the health-care resource consumed in each alternative • Assign dollar values to each resource consumed
Ten Steps of Performing An Economic Evaluation Study (cont.) • Specify and monitor nonmedical resources consumed by each alternative • Specify the unit of outcome measurement • Specify other noneconomic attributes of the alternatives, if appropriate • Analyze the data • Conduct a sensitivity analysis
CBA Example • Cost per flu shot = $10 • Treatment cost per flu = $250 • Productivity loss from sick leave = $4,000 • Employees = 1000 • W/o vaccine: 50 have flu, 3 absence • W/ vaccine: 30 have flu, 1 absence • What should the manager do?
CBA Example (cont.) Net Benefit = benefit - cost =(number of flu avoided)*$250 + (number of absence avoided)*$4000 - $10*1000 =20*$250+2*$4000-$10000 =$3000 > 0
CBA Example (cont.) • New flu vaccine available • Cost = $20 • W/ the new vaccine: • 5 have flu, no absence from work • Which one should the manager choose?
CBA Example (cont.) • NB(new) =45*$250+3*$4,000-$20*1,000 =$3,250 • NB(new) > NB(old) choose the new vaccine • However, if productivity loss = $3000, then NB(old)=$1000, and NB(new)=$250, then the old vaccine will be chosen
CEA Example • C-E of two mumps vaccines • Perspective: • Several possibilities: state government, or other third party payers. • Describe alternatives: • Vaccine A (old): cheaper, not as effective • Vaccine B (new): more expensive, more effective • Do nothing
CEA Example (cont.) • Possible outcomes and prob. • Outcomes: Mumps infection, death • probability of infections • Vaccine A:3%, Vaccine B: 0.5%, do nothing: 5% • probability of death: • vaccine A: 0.1%, vaccine B: 0%, do nothing: 0.3% • Health care resource consumed: • Vaccine A: vaccine cost + treatment cost • Vaccine B: vaccine cost + treatment cost • Do nothing: treatment cost
CEA Example (cont.) • Assign $ to each resource consumed • Vaccine A: $10 /shot, $250 per treatment • Vaccine B: $20 /shot, $250 per treatment • Do nothing: $250 per treatment • Nonmedical resources • Vaccine A: None • Vaccine B: None • Do thong: None • Unit of outcome measures • Death avoided from vaccination