Download
1 / 37
400 likes | 601 Views
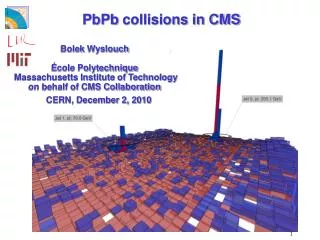
G ábor I. Veres CERN Geneva and ELTE Budapest CMS Collaboration. Based on: - JHEP 1009:091,2010 - My talk at ECT* Trento: QCD at the LHC, September 28, 2010 - CERN seminar talks by Gunther Roland and Guido Tonelli, Sept. 21, 2010.

E N D
Gábor I. Veres CERN Geneva and ELTE Budapest CMS Collaboration Based on: - JHEP 1009:091,2010 - My talk at ECT* Trento: QCD at the LHC, September 28, 2010 - CERN seminar talks by Gunther Roland and Guido Tonelli, Sept. 21, 2010 Zimányi 2010 Winter School on Heavy Ion Physics, 29 Nov 2010, RMKI/ELTE Budapest • The CMS detector • Two-particle correlation functions • Results in minimum bias collisions • Results in high multiplicity collisions • Cross-checks
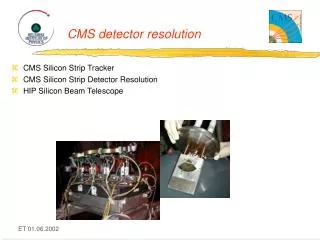
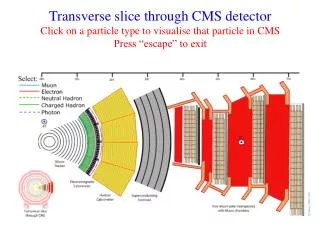
The CMS Silicon Tracker Coverage up to||<2.5; extremely high granularity, to keep low occupancy (~ a few%) also at LHC nominal luminosity. Largest Silicon Tracker ever built: Strips: 9.3M channels; Pixels: 66M channels.Operational fractions: strips 98.1%; pixel 98.3% TOB TOB TEC TIB PD TIB TID PD
Angular Correlation Functions I. Definition Correlation Functions: II. Anatomy
Correlation Function Definition Signal distribution: Background distribution: Same event pairs Mixed event pairs Ratio Signal/Background pT-inclusive two-particle angular correlations in minimum bias collisions CMS pp 7TeV
Angular Correlation Functions “Away-side” (Df ~ p) jet correlations: Correlation of particles between back-to-back jets CMS 7TeV pp min bias Bose-Einstein correlations: (Df ,Dh) ~ (0,0) Momentum conservation: ~ -cos(Df) Short-range correlations (Dh < 2): Resonances, string fragmentation, “clusters” “Near-side” (Df ~ 0) jet peak: Correlation of particles within a single jet
Correlations in Min Bias pp CMS pp Data Pythia D6T
Short-Range Correlations vs. s Keff: Number of correlated particles d: correlation width in Dh 1D “Projection” to Dh axis CMS PYTHIA describes the energy dependence, matches cluster width d in data, but underestimates the cluster multiplicity Keff CMS
High Multiplicity Events 268 reconstructed particles in the tracker in a single pp collision: the highest multiplicity event in ~70 billion inelastic events sampled (1/pb)
Why study extreme multiplicities? • Our most recent correlation studies focus on the tail of the distribution, where several MC generators severely under-estimate the data • (an exception: PYTHIA8). • Motivations: • Trying to find (more) unexpected effects in this regime • Learn more about (soft) QCD and particle production mechanisms with more differential measurements • Highest multiplicities in pp begin to approach those in ion collisions; can we learn something about similarities or differences?
High Multiplicity Trigger Dedicated trigger was needed to record highest multiplicities Level-1 (hardware): Requires ET> 60 GeV in calorimeters High-Level trigger (software): More than 70 (85) tracks with pT > 0.4 GeV/c, |h| < 2, within dz < 0.12 cm of a single vertex with z < 10 cm. ~50% CPU usage of the HLT
High Multiplicity Event Statistics 1000 times more high multiplicity events recorded with the trigger compared to Min. Bias Multiplicity binning uses pT > 0.4 GeV/c |Dh| < 2.4 Two different HLT thresholds: Nonline > 70 and Nonline > 85 HLT85 trigger range un-prescaled for full 980nb-1 out of 5x10¹⁰ collisions
Event and Track Selection Event-selection and analysis done with tracks pointing to primary vertex with O(100mm) resolution
Results : data, inclusive pT high multiplicity (N>110) MinBias Jet peak/away-side correlations enhanced in high multiplicity events Abundant jet production in high multiplicity sample
Results: data, inclusive pT high multiplicity (N>110) MinBias After cuting off the jet peak at (0,0) we can observe: Structure of away-side ridge (back-to-back jets) Small change for large dh around df ~ 0 ?
Results: data, pT: 1-3 GeV/c high multiplicity (N>110) MinBias Pronounced new structure at large dh, around df ~ 0 ! CMS Collab., JHEP 1009:091,2010, arXiv:1009:4122
Illustration of the effect p ?! p Particles surfacing in the same time zone, but far away in latitude, talk to each other… …What mechanism is the “telephone line”?
Correlations in PYTHIA8 Nodf ~0 structure at large dh Same for Herwig++, madgraph, PYTHIA6
Multiplicity- and pT -Dependence Increasing pT Increasing multiplicity Project |Dh| > 2 onto Df !!! !!! “Ridge” maximal for highest multiplicity and 1 < pT < 3 GeV/c
Quantifying the associated yield Zero Yield At Minimum (ZYAM) • Data • - PYTHIA8 N>110 2.0<||<4.8 1GeV/c<pT<2GeV/c Associated yield: correlated multiplicity per particle Minimum of R 2.0<||<4.8 Associated yield grows with increasing multiplicity
Like-Sign vs. Unlike-Sign Pairs No dependence on relative charge sign
Systematic Uncertainties, Checks Statistical uncertainty negligibly small However, the signal is subtle and unexpected Estimate systematic uncertainties Is there a way to fake the signal qualitatively?
Systematic Uncertainties + bugs? Test the complete chain with data-driven checks! Analysis code Reconstruction Trigger Detector CMS Event Collision + efficiency, fakes + trigger efficiency, bias + detector noise, acceptance, efficiency + pile-up, beam backgrounds Physics
Analysis Code Control analysis II Standard analysis Control analysis I N>110 1<pT<3GeV/c |Dh|>2 Independent code Different definition of R Different input file (skim) Independent code Same definition of R Same input file (skim) Ridge is seen with three independent analysis codes
Reconstruction Code N>110 1<pT<3GeV/c Pixel-only tracks 3 hits in pixel detector “HighPurity” tracks Pixel + Silicon Strip tracker (Largely) independent code Independent detectors Also: variation of tracking +vertexing parameters
Trigger bias Min-bias trigger vs. high mult trigger HLT 70 vs. HLT 85 for N > 110 Min bias trigger 1<pT<2GeV/c |Dh|>2 N>110 1<pT<2 GeV/c |Dh|>2 No trigger bias seen from comparison of trigger paths Ridge is seen using min bias trigger + offline selection
Detector: -symmetry Pair multiplicity distribution for ||>2 and ||<1 Constrain one track to one f-octant • Signal • Background N>110 1<pT<2 GeV/c |Dh|>2 N>110 1<pT<2 GeV/c |Dh|>2 Ridge is not caused by rare events with large # of pairs Ridge is invariant under f rotation
Detector: uniformity in Ridge region shows no structure in h1 vs h2
Event Backgrounds Enrich the sample with beam-gas and beam-scraping events Reject beam background by veto on fraction of low quality tracks CMS preliminary Increased beam scraping events Increased beam halo Standard event selection N>110 1<pT<2GeV/c |Dh|>2 No eff correction N>110 1<pT<2GeV/c |Dh|>2 CMS preliminary Ridge region shows no sensitivity to beam background Note: Analysis is done on HighPurity tracks
Pileup collision events Correlate tracks from high multiplicity vertex with tracks from different collision (vertex) in same bunch crossing N>110; 1 GeV/c<pT<3 GeV/c 2.0<||<4.8 No background or noise effects seen in cross-collision correlations
Pileup of collision events Compare different run periods (fraction of pileup varies by x4-5) Compare different vertex regions (fraction of pile-up ~ dN/dvtxz) 1<pT<2GeV/c |Dh|>2 CMS preliminary CMS preliminary CMS preliminary Change in pileup fraction by factor 2-4 has almost no effect on ridge signal Fraction of pileup 31
Event Pileup Track longitudinal and transverse impact parameter (pT > 0.4 GeV/c) Single-event track dz distribution Pileup effects are suppressed due to excellent resolution Track counting done with sdz, sdxyof O(100mm)
Track-Photon Correlations Use ECAL “photon” signal Mostly single photons from p0’s No efficiency, and pT, f smearing corrections N>110 1<pT<3GeV/c CMS preliminary N>110 1<pT<3GeV/c |Dh|>2 Note: photons reconstructed using “particle flow” event reconstruction technique
Photon-Photon Correlations Use ECAL “photon” signal Mostly single photons from p0’s No efficiency, and pT, f smearing corrections N>110 1<pT<3GeV/c CMS preliminary N>110 1<pT<3GeV/c |Dh|>2 Qualitative confirmation Independent detector, independent reconstruction
Systematic Uncertainties Analysis code Reconstruction Trigger Detector CMS Event Collision Each step tested with data-based checks No indication of effect that would fake ridge signal Conservative estimates of uncertainties on ridge associated yield
Summary • Study of short-range and long-range angular correlations in pp collisions with CMS at LHC • Observation of long-range, near-side correlations in high multiplicity events • Signal grows with event multiplicity • Effect is maximal in the 1 < pT < 3 GeV/c range • Not observed in low multiplicity events • Not observed in MC generators • This is a subtle effect in a complex environment – careful work is needed to establish physical origin