Download
1 / 12
120 likes | 252 Views
RotasPro Gear Test and Noise Analysis. Torsional Analysis of Single Gears. dBV. 80. Mix. 70. Antrieb. 40 Nm. 10-40 Nm. 60. GM. Ghost Orders. 50. 2 *GM. 40. 50. 60. 70. 80. 90. 100. 110. 120. 130. Ord. MTE/Torsional Acceleration Measurement.

E N D
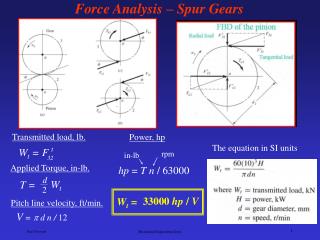
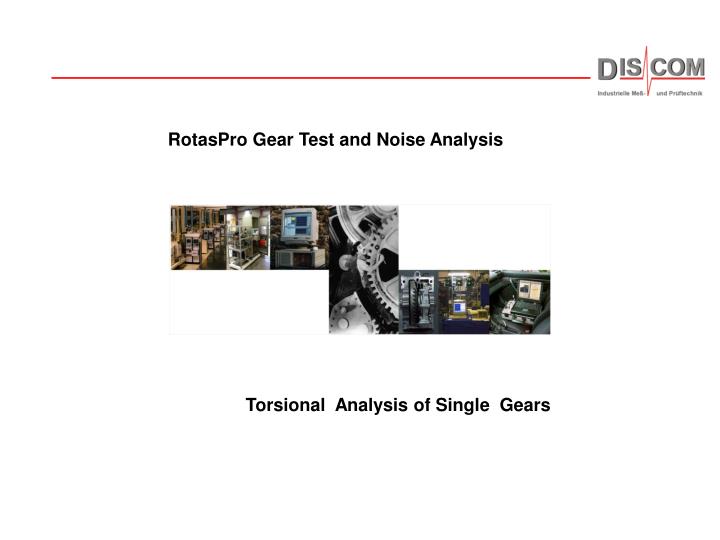
RotasPro Gear Test and Noise Analysis Torsional Analysis of Single Gears
dBV 80 Mix 70 Antrieb 40 Nm 10-40 Nm 60 GM Ghost Orders 50 2 *GM 40 50 60 70 80 90 100 110 120 130 Ord MTE/Torsional Acceleration Measurement Mechanical Layout of Test Machine Rotas NVH Analysis Tested Gear Torsional Accelerometer Test Sequence is steady speed or ramp n 3000 0 t M 15-20 s 0 t
Revolution Synchronous Transmission Analysis The transmission noise is the sum of the noise originating from the individual mechanical components. For the gear noise components, the individual sources can be isolated by the transmission ratio. Input Shaft Interm. Shaft Output Shaft Synchronous order analysis: The signals are acquired synchronous to the inner shafts. Acoustical Stroboscope Input Shaft Interm. Shaft Output Shaft
Torsional Accelerometer Optical Receiver Power Transformer Into Rotator LED Sender Accelerometers Rotational ensor
Torsional Accelerometer Accelerometers measure the deviation from uniform circular motion Power Transformer Into Rotator Optical Receiver Optical Sender Accelerometers Rotating Sensor
Single Flank Gear Tester Linnenbrink Torsional Accelerometer Test gear Master Gear
Results from Crank/Cam Gear pairs Graphs show one revolution of the crank and the cam gear when run as pairs on the single flank gear tester. The faults can be easily detected. Crank Gear Cam Gear Good Gear Set Eccentricity on Cam Gear Nick on Cam Gear
Comparing DIN 3960 composite inspection Graphs show one revolution of the cam gear when run as pairs on the single flank gear tester. The good and the bad gear set show less variation with this method. Fi’ is even smaller for the bad gear fk’ tooth to tooth deviation short wave component fk’ fk’ Fi’ tangential composite deviation Long wave component Fi’ Fi’ Eccentricity on Cam Gear Good Gear Set
dBV 80 Mix 70 Antrieb 60 50 40 50 60 70 80 90 100 110 120 130 Ord Synchronous Averaging III Revolution synchronous averaging gives periodic (cyclic) signals. This corresponds to the cyclic nature of the gear sets. These signals can be transformed into the spectral domain without any time domain leakage windows. This allows for high spectral resolution. Eccentricities can be easily distinguished from the gear mesh orders. The noise components can be attributed to their origins. Blue: Conventional order spectrum with Kaiser Bessel Window Green: Revolution synchronous order spectrum without window function GM 2 *GM Ghost Orders Ecc..
Results from Single Flank Gear Tester Drive Coast H3 H1 H2 Crank Cam Various filed units shown as stray bands. The gear mesh energies are clearly seen.
Measurement Statistics and Bench Comparison Over 300 individual measurement results can be evaluated. The comparison of test benches makes it easy to administer large production facilities.
Spectral Statistics Order spectra of production units can be displayed in Campbell or in 3-D graphs. Cuts in the order or in the unit direction show order amplitude versus units or the spectrum of one unit. The pictures show the order spectra of 300 production units. A ghost order of 118 is present in the first 40 units tested.