Download
1 / 29
290 likes | 441 Views
Day 8. Represent relations Interpret graphs of relations. Relations. Using a coordinate graph system http://www.coolmath.com/algebra/08-lines/02-plotting-points-01.htm. Coordinate system Ordered pairs (x, y) Quadrants I, II, III, IV Y- coordinate X- coordinate X-axis Y-axis.

E N D
Day8 • Represent relations • Interpret graphs of relations Relations
Using a coordinate graph systemhttp://www.coolmath.com/algebra/08-lines/02-plotting-points-01.htm Coordinate system Ordered pairs (x, y) Quadrants I, II, III, IV Y- coordinate X- coordinate X-axis Y-axis
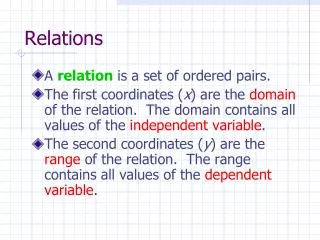
Representation of a Relation • Domain and Range • Ordered Pairs: (1,2), (-2, 4), (0, -3) • Table Graph Map
Representation of a Relation • Domain and Range • Ordered Pairs: (2,5), (-2, 3), (5, -2), (-1, -2) • Table Graph Map
What are three ways to represent a relation? * * * Show {(4, -3), (3,2, (-4,1), (0, -3)} as a relation in three ways.
Independent and Dependent variables • Identify the independent and dependent variables: • The committee is selling tickets to the Fall Ball. The tickets that they sell, the greater the amount of money they can spend for decorations. • Independent: Dependent: • Generally, the average price of going to the movies has steadily increased over time. • Independent: Dependent: • The air pressure inside a tire increases with the temperature. • Independent: Dependent: • As the amount of rain decreases, so does the water level of the river. • Independent: Dependent:
Interpreting graphs • http://www.wtamu.edu/academic/anns/mps/math/mathlab/beg_algebra/beg_alg_tut9_bar.htm
Functions Determine whether a relation is a function Find function values
What is a function? • A function is a relationship between input and out put. In a function there is exactly one output for each input. • A function is a relation in which each element of the domain is paired with exactly one element of the range • Domain Range -3 0 3 4 5 3 2 1
What is a function? • A function is a relationship between input and out put. In a function there is exactly one output for each input. • A function is a relation in which each element of the domain is paired with exactly one element of the range • Domain Range -2 0 3 4 -3 6 9 Is this a function – why or why not?
At an ice sculpting competition, each sculpture’s height was measured to make sure that it was within the regulated height range of 0 to 6 feet. The measurements were as follows: Team 1, 4 feet;; Team 2, 4.5 feet; Team 3, 3.2 feet; Team 4, 5.1; Team 5, 4.8. • Make a table Determine the domain and range of the function Write the data as a set of ordered pairs. Then graph the data data. • State whether the function is discrete or continuous.
Equations as Functions • -3x + y = 8 • Y = 8 + 3y • You can check If it is a function Using the vertical Line test
Discrete vs. continuous • Discrete Continuous • Use the vertical line test to check if it is a function.
Function notation • F(x) = -4x + 7 • F(2) F(-3) +1
h(t) = -16+ 68t +2 • h(4) 2[h(g)]
Assignment • Chapter Test – Thursday • Pp 44-46; 9-20, 40, 42-60 • Pp.51-54; 20-44, 49, 50,52,54-75
You identified functions and found function values. Identify and interpret key features of the graphs of functions.
Linear Graph that is a straight line. Non-Linear Graph that is not a straight line. Linear v.Non-Linear
X-intercepts The x-coordinate of the point at which a graph intersects the x-axis. Y-intercepts The y-coordinate of the point at which a graph intersects they-axis. Intercepts: Graph touches an axis
Line of Symmetry Each half of the graph on either side of the line matches exactly.
Relative Minimum Relative Maximum Extrema: Relatively high/low points
Positive Where the graph lies above the x-axis. Negative Where the graph lies below the x-axis. Positivev. Negative
Increasing Where the graph goes up. Decreasing Where the graph goes down. Increasingv. Decreasing
Describe/ label the following features of the function below: • Linear or Non-Linear? non-linear • x-intercept and y-intercepts? x=7.2 and y=30 • Line of symmetry? none • Positive/ negative? positive: 0 < t < 7.2 negative: t > 7.2 minutes • Increasing/ decreasing? increasing: t < 1, 4 < t < 6 decreasing: 1 < t < 4, t > 6 • Extrema? min: t = 4 max: t = 1 and t = 6 • End behavior? As x increases, y decreases. As x decreases, y decreases.
Describe/ label the following features of the function below: Non-linear • Linear or Non-Linear? • x-intercept and y-intercepts? x=5.5 and y=80 • Line of symmetry? • Positive/ negative? Positive: between x = 0 and x = 5.5 Negative: for about x > 5.5 • Increasing/ decreasing? Increasing: between x = 1 and x = 4 Decreasing:for x < 1 and x > 4 • Extrema? Maximum: at about x = 4 Minimum: at about x = 1 • End behavior? As x increases, y decreases. As x decreases, y increases. None
Activity • Draw a graph using at least 3 of the features discussed today. • In complete sentences on the back of the graph, explain how the three terms are demonstrated in the graph you drew.