Download
1 / 23
260 likes | 508 Views
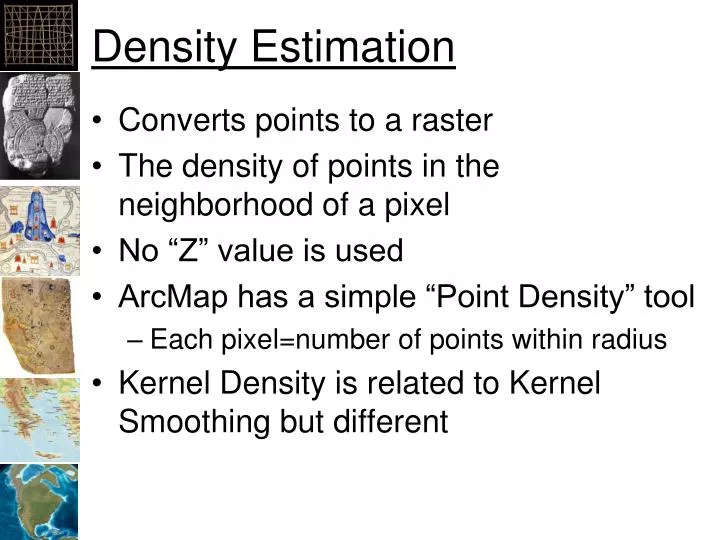
Density Estimation. Converts points to a raster The density of points in the neighborhood of a pixel No “Z” value is used ArcMap has a simple “Point Density” tool Each pixel=number of points within radius Kernel Density is related to Kernel Smoothing but different. Density Estimation.

E N D
Density Estimation • Converts points to a raster • The density of points in the neighborhood of a pixel • No “Z” value is used • ArcMap has a simple “Point Density” tool • Each pixel=number of points within radius • Kernel Density is related to Kernel Smoothing but different
Density Estimation • Simple point density: Golf courses Fail Rockware
Point Density in ArcMap Distance=0.3 Distance=3
Point Density in ArcMap Distance=10
Kernel Smoothing • Kernel Smoothing is interpolation
Density Estimation Using Kernels • Creates a raster from points • Weight (attribute) optional • Not really interpolation • “Kernel function” applied to points near target pixel • Different functions are available • High parameters make a “wide” pile,small values make a “narrow” pile
Width of Kernel • Determines smoothness of surface • narrow kernels produce bumpy surfaces • wide kernels produce smooth surfaces
Kernel Density in ArcGIS 10 • Under Spatial Analyst -> Kernel Density • The kernel function is based on the quadratic kernel function described in Silverman (1986, p. 76, equation 4.5).
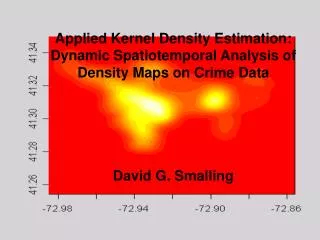
Overview • This analysis show where point features are concentrated. • Estimations are based on probability “kernels” • regions around each point location containing some likelihood of point presence. • The width of the kernel is based on the smoothing parameter (h) • The output is often called a Utilization Distribution (UD) Grid. • Methods include: minimum convex polygons, bivariate ellipses, adaptive and fixed kernels
Kernel Density • Cell Size = 0.05 • Search Radius = 0.4?
Kernel Density • Cell Size = 0.05 • Search Radius = 10
How to select parameters? • What should the cell size be? • What should the search radius be?
Kernel Density Analysis Amelia O’Connor
Other tool extensions for kernel density: • Home Range Tools • Animal Movement • Biotas • Home Ranger 1.5 • KernelHR
Spatial Stats Toolbox • New in ArcGIS 10 • Additional tools in ArcGIS 10.2 • By Lauren Rosenshein
Hot-Spot Analysis • Layer may show “hot-spot” but is it really? • Z-score and P-value are required • Z-score = high or low values together? • P-value = random?
Hot-Spot Analysis • High z-values indicate a significantly high or low value • 2.5=cluster of high or low values • P-value is the chance a pattern is random • 0.01=probably not random
Citations • Bugoni, L., D'Alba, L., and Furness, R. W. (2009) Marine habitat use of wintering spectacled petrels Procellariaconspicillata, and overlap with longline fishery. Marine Ecology Progress Series374:273-285. • Mitchell, Brian R. (2007) Comparison of Programs for Fixed Kernel Home Range Analysishttp://www.wildlife.org/wg/gis/newsletter/jun06/hrcompar.htm • Silverman, B. W. Density Estimation for Statistics and Data Analysis. New York: Chapman and Hall, 1986. • ArcGIS 10 resource center; Kernel Density (Spatial Analyst) http://help.arcgis.com/en/arcgisdesktop/10.0/help/index.html#//009z0000000s000000.htm • http://help.arcgis.com/en/arcgisdesktop/10.0/help/index.html#/Understanding_density_analysis/009z0000000w000000/ • http://help.arcgis.com/en/arcgisdesktop/10.0/help/index.html#//009z00000011000000.htm