Download
1 / 10
100 likes | 157 Views
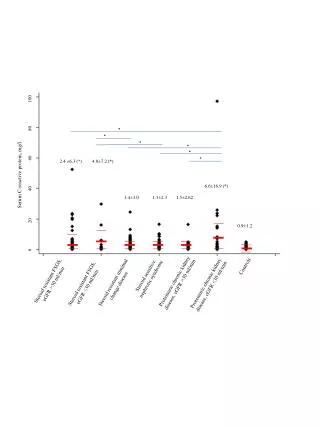
This study compares multiple data sets using statistical analysis with accompanying figures and confidence intervals. Explore the various results and their implications for further research in this comprehensive analysis.

E N D
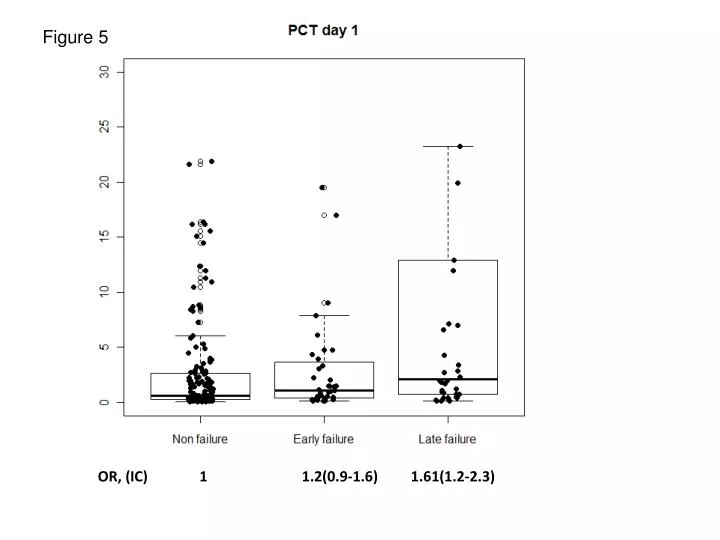
Figure 5 OR, (IC) 1 1.2(0.9-1.6) 1.61(1.2-2.3)
Figure 2 OR, (IC) 1 2.01 (1.3-3.1)
Figure 3 OR, (IC) 1 0.73 (0.5-1.0)
Figure 4 OR, (IC) 1 0.80(0.6-1.1) 0.71 (0.5-1.0)
Figure 5 OR, (IC) 1 0.76(0.52-1.1)
Figure 6 OR, (IC) 1 2.07(1.4-3.0)
Figure 7 OR, (IC) 1 1.85(1.3-2.5) 1.72 (1.2-2.4)
Figure 8 OR, (IC) 1 1.70 (1.2-2.5)
Figure 9 OR, (IC) 1 1.52(1.1-2.1)
Figure 10 OR, (IC) 1 1.37(1.0-1.9) 1.44(1.1-2.0)