Download
1 / 29
290 likes | 425 Views
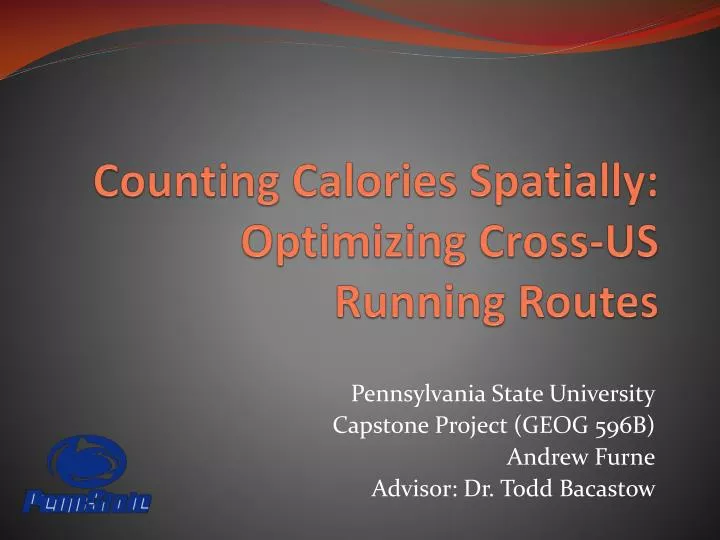
Counting Calories Spatially: Optimizing Cross-US Running Routes. Pennsylvania State University Capstone Project (GEOG 596B) Andrew Furne Advisor: Dr. Todd Bacastow. Table of Contents. Background: Explorers to Runners Destination: Connect the Fleets Study Factors Research Objectives

E N D
Counting Calories Spatially: Optimizing Cross-USRunning Routes Pennsylvania State University Capstone Project (GEOG 596B) Andrew Furne Advisor: Dr. Todd Bacastow
Table of Contents • Background: Explorers to Runners • Destination: Connect the Fleets • Study Factors • Research Objectives • Google Maps • Treadmill Calorie Expenditure • Directional Analysis (Gradient) • Directional Analysis (Wind) • Analysis Factor (Temperature) • Final Results: Route Comparison • Research Objectives: Answered • Future Study
Background: Explorers to Runners To date, there have been 266 Runners to complete the trek. In 2011 alone, there were 24 runners.
Destination: Connect the Fleets Second Fleet Virginia Beach, VA Third Fleet San Diego, CA
Research Objectives • What is the optimal route, based on energy (kilocalories) consumption, from San Diego to Virginia Beach? • Is the shortest walking route determined by Google Maps more energy efficient? • Does the direction of travel across the United States (East to West / West to East) make a difference? • Is the World Record running route across the United States more efficient than the determined route?
Treadmill Calorie Expenditure • Convert Units. • 7.5 mph = 201 meters/minute • 160lbs = 72.7273 kg • 30 meters = .1493 minutes • Oxygen Used (mL/kg/min) • (.2 x Speed) + (.9 x Speed x Slope) + 3.5 • Calories/Minute • mL/kg/min x Weight x 3.5 /200 • Calorie Expenditure per 30 meter cell • Calories/Minute x Time in Minutes
Treadmill Calorie Expenditure:Route Analysis Calorie Expenditure: 3,350,998 kcals Length: 346,038 Meters
Directional Analysis (Gradient): Backlink and Aspect D N LR LL NW NE R L W E Aspect Backlink UR SW UL SE U S
Directional Analysis (Gradient): Incline and Decline 30 3 20 2 40 4 WEST 1 EAST 10 50 5 Backlink Aspect 80 8 60 6 70 7 Incline (Value 11) Decline (Value 15)
Directional Analysis (Gradient)Route Analysis East to West - Calorie Expenditure: 3,189,252 kcals Length: 349,865 Meters West to East - Calorie Expenditure: 3,156,370 kcals Length: 345,715 Meters
Directional Analysis (Wind):Backlink and Wind Direction D N NNW NNE LR LL NW NE WNW ENE R L W E Backlink WSW ESE UR UL SW SE SSE U SSW S
Directional Analysis (Wind): Headwind and Tailwind 30 3 3 3 Headwind (Value 55) 20 2 4 40 EAST WEST 1 5 1 5 10 50 1 5 6 8 80 60 Tailwind (Value 51) 7 7 7 70 Wind Effect Headwinds = .95 (+5%) Tailwinds = 1.08 (-8%) < 10 MPH = 1.00 (No Effect)
Directional Analysis (Wind):Route Analysis East to West - Calorie Expenditure: 3,134,995 kcals Length: 344,611 Meters West to East - Calorie Expenditure: 3,080,250kcals Length: 345,206 Meters
Analysis Factor (Temperature):Over 60 degrees - MPH to MPerMin Decrease Runner’s pace by 30 seconds per mile for each 5 degrees over 60
Analysis Factor (Temperature):Pace Modification for 1 MPH August
Analysis Factor (Temperature):Route Analysis Calorie Expenditure: 3,165,146 kcals Length: 345,741.00 Meters
Research Objectives: Answered • What is the optimal route, based on energy (kilocalories) consumption, from San Diego, California to Virginia Beach, Virginia? • The optimal route across the U.S. could not be determined due to unreasonable processing time. • Is the shortest walking route determined by Google Maps from San Diego, CA to Virginia Beach, VA more energy efficient, than the optimal route? • For the test area, the determined route with the shortest distance did not have the least calorie expenditure. Therefore, the shortest distance is not necessarily the most energy efficient. • Does the direction of travel across the United States (East to West or West to East) make a difference? • For the test area, the directional factors of gradient and wind for the month of March identified West to East as the optimal direction of travel. • Is the World Record running route across the United States more efficient than the determined route? • As discussed, this objective was eliminated due to the difficulty and time required to capture the route accurately and acquire the data.
Future Study • Data. • More accurate data. • Criteria. • Gather more accurate statistics. • Test on local areas • Crowd-Sourcing • Model. • Automate the analysis. • Web Service. • Publish the model as a service.