Download
1 / 1
10 likes | 179 Views
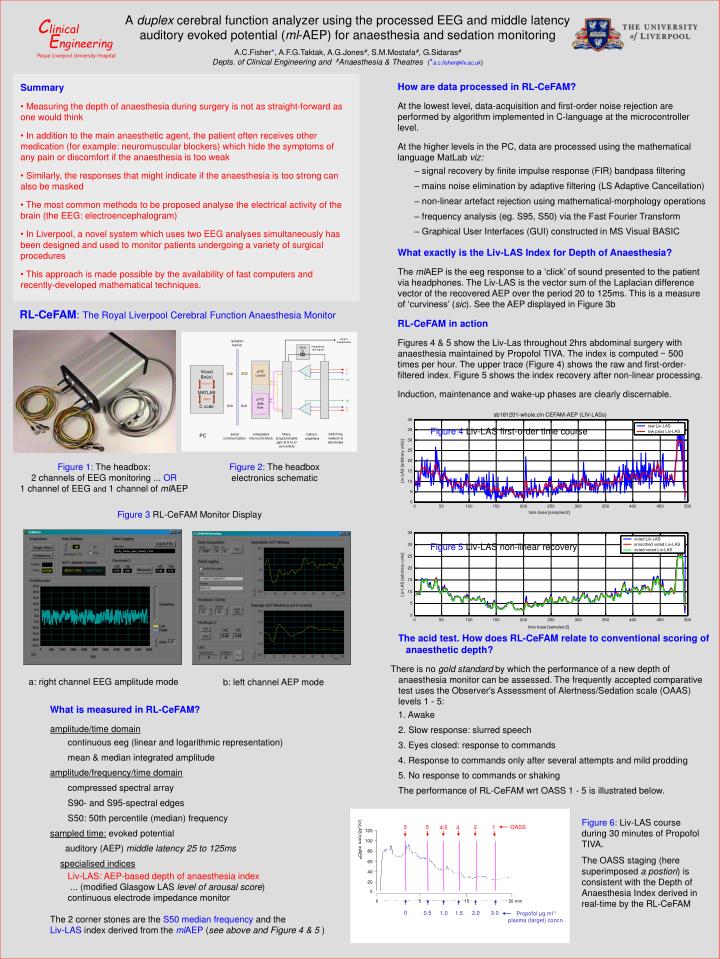
click to headphones. isolation barrier. impedance test signal. ~. C linical. 5kHz. ~. Tony_Fisher_eyes_closed_1.cfm. E ngineering. Visual B ASIC MATLAB. Royal Liverpool University Hospital. PIC control. e +. SE90 17.5Hz. SE90 15.0Hz. 4.2k. 3.8k. 6.4k. 4.7k. e -. ref.

E N D
click to headphones isolation barrier impedance test signal ~ Clinical 5kHz ~ Tony_Fisher_eyes_closed_1.cfm Engineering Visual BASIC MATLAB Royal Liverpool University Hospital PIC control e+ SE90 17.5Hz SE90 15.0Hz 4.2k 3.8k 6.4k 4.7k e- ref Active X PIC data flow CMEX ref C code e- e+ 0 0.5 2.0 1.5 1.0 4.2k 3.2k switching network & electrodes serial communication embedded microcontrollers filters, programmable gain & A-to-D converters instrum. amplifiers PC Figure 4 Liv-LAS first-order time course sb181201-whole.cln CEFAM-AEP (LIV-LASs) 40 raw Liv-LAS 35 low pass Liv-LAS 30 25 20 Liv-LAS [arbitrary units] 15 10 5 35 time base [samples/2] voted Liv-LAS 0 Figure 5 Liv-LAS non-linear recovery 0 50 100 150 200 250 300 350 400 450 500 smoothed voted Liv-LAS time base [samples/2] voted-voted Liv-LAS Liv-LAS [arbitrary units] 30 25 LivLAS form mlAEP 20 5 1 OASS 5 2 4/5 4 15 10 5 0 0 50 100 150 200 250 300 350 400 450 500 0 0 5 15 20 min 3.0 Propofol μg.ml-1 plasma (target) concn. A duplex cerebral function analyzer using the processed EEG and middle latency auditory evoked potential (ml-AEP) for anaesthesia and sedation monitoring A.C.Fisher*, A.F.G.Taktak, A.G.Jones#, S.M.Mostafa#, G.Sidaras# Depts. of Clinical Engineering and #Anaesthesia & Theatres (*a.c.fisher@liv.ac.uk) • How are data processed in RL-CeFAM? • At the lowest level, data-acquisition and first-order noise rejection are performed by algorithm implemented in C-language at the microcontroller level. • At the higher levels in the PC, data are processed using the mathematical language MatLab viz: • signal recovery by finite impulse response (FIR) bandpass filtering • mains noise elimination by adaptive filtering (LS Adaptive Cancellation) • non-linear artefact rejection using mathematical-morphology operations • frequency analysis (eg. S95, S50) via the Fast Fourier Transform • Graphical User Interfaces (GUI) constructed in MS Visual BASIC What exactly is the Liv-LAS Index for Depth of Anaesthesia? The mlAEP is the eeg response to a ‘click’ of sound presented to the patient via headphones. The Liv-LAS is the vector sum of the Laplacian difference vector of the recovered AEP over the period 20 to 125ms. This is a measure of ‘curviness’ (sic). See the AEP displayed in Figure 3b RL-CeFAM in action Figures 4 & 5 show the Liv-Las throughout 2hrs abdominal surgery with anaesthesia maintained by Propofol TIVA. The index is computed ~ 500 times per hour. The upper trace (Figure 4) shows the raw and first-order-filtered index. Figure 5 shows the index recovery after non-linear processing. Induction, maintenance and wake-up phases are clearly discernable. • Summary • Measuring the depth of anaesthesia during surgery is not as straight-forward as one would think • In addition to the main anaesthetic agent, the patient often receives other medication (for example: neuromuscular blockers) which hide the symptoms of any pain or discomfort if the anaesthesia is too weak • Similarly, the responses that might indicate if the anaesthesia is too strong can also be masked • The most common methods to be proposed analyse the electrical activity of the brain (the EEG: electroencephalogram) • In Liverpool, a novel system which uses two EEG analyses simultaneously has been designed and used to monitor patients undergoing a variety of surgical procedures • This approach is made possible by the availability of fast computers and recently-developed mathematical techniques. RL-CeFAM:The Royal Liverpool Cerebral Function Anaesthesia Monitor Figure 1: The headbox: 2 channels of EEG monitoring ... OR 1 channel of EEG and 1 channel of mlAEP Figure 2: The headbox electronics schematic Figure 3 RL-CeFAM Monitor Display • The acid test. How does RL-CeFAM relate to conventional scoring of anaesthetic depth? • There is no gold standard by which the performance of a new depth of anaesthesia monitor can be assessed. The frequently accepted comparative test uses the Observer's Assessment of Alertness/Sedation scale (OAAS) levels 1 - 5: • Awake • Slow response: slurred speech • Eyes closed: response to commands • Response to commands only after several attempts and mild prodding • No response to commands or shaking • The performance of RL-CeFAM wrt OASS 1 - 5 is illustrated below. a: right channel EEG amplitude mode b: left channel AEP mode • What is measured in RL-CeFAM? • amplitude/time domain • continuous eeg (linear and logarithmic representation) • mean & median integrated amplitude • amplitude/frequency/time domain • compressed spectral array • S90- and S95-spectral edges • S50: 50th percentile (median) frequency • sampled time: evoked potential • auditory (AEP) middle latency 25 to 125ms • specialised indices • Liv-LAS: AEP-based depth of anaesthesia index • ... (modified Glasgow LAS level of arousal score) • continuous electrode impedance monitor • The 2 corner stones are the S50 median frequency and the • Liv-LAS index derived from the mlAEP (see above and Figure 4 & 5 ) Figure 6: Liv-LAS course during 30 minutes of Propofol TIVA. The OASS staging (here superimposeda postiori) is consistent with the Depth of Anaesthesia Index derived in real-time by the RL-CeFAM