Download
1 / 8
80 likes | 99 Views
Explore equilibrium/free energy curve diagrams and Ellingham diagrams to understand reactions like methane with oxygen, rusty crowbar turning shiny, Haber process, and more. Learn about entropy, temperature variations, and spontaneous reactions in chemistry.

E N D
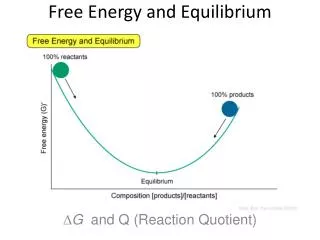
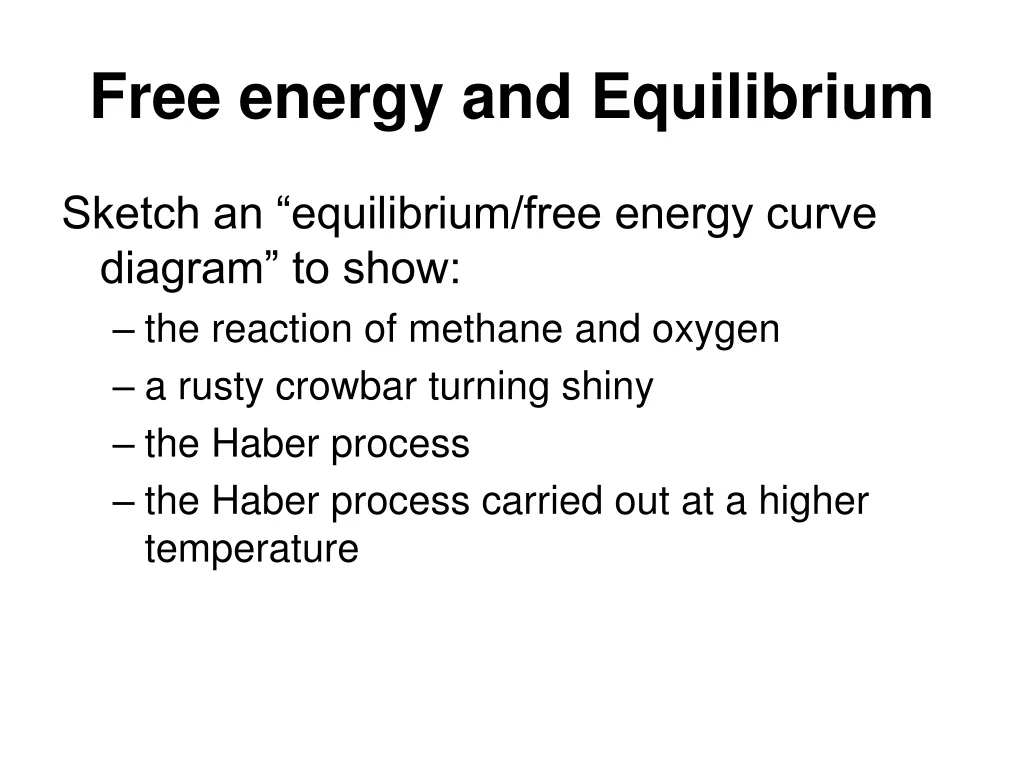
Free energy and Equilibrium Sketch an “equilibrium/free energy curve diagram” to show: • the reaction of methane and oxygen • a rusty crowbar turning shiny • the Haber process • the Haber process carried out at a higher temperature
Ellingham diagrams Sketch Ellingham diagrams to show: • the reaction of carbon and oxygen to produce carbon monoxide • the reaction of aluminium and oxygen to form aluminium oxide
Gº, kJ mol-1 CO + O2CO2 1⅓Al + O2 ⅔Al2O3 Temperature, K
What do all the lines in Ellingham diagrams have in common? • What does a change in gradient in an Ellingham diagram show?
Some other problems... Which of the following processes will have a change in entropy of less than 0?
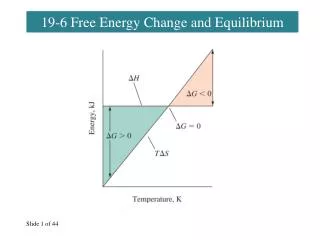
The following graph of the change in free energy versus temperature (T) corresponds to which of the following situations?
For the reaction in which solid carbon dioxide (dry ice) sublimes to become gaseous carbon dioxide, CO2(s) CO2(g), which of the following is true for the reaction as written? • The reaction is endothermic and the entropy decreases • The reaction is endothermic and the entropy increases • The reaction is exothermic and the entropy decreases • The reaction is exothermic and the entropy increases
True or false? • A spontaneous reaction always releases heat. • A spontaneous reaction is always a fast reaction. • The entropy of a system always increases for a spontaneous reaction. • The entropy of a system and its surroundings always increases for a spontaneous reaction.