Download
1 / 7
70 likes | 174 Views
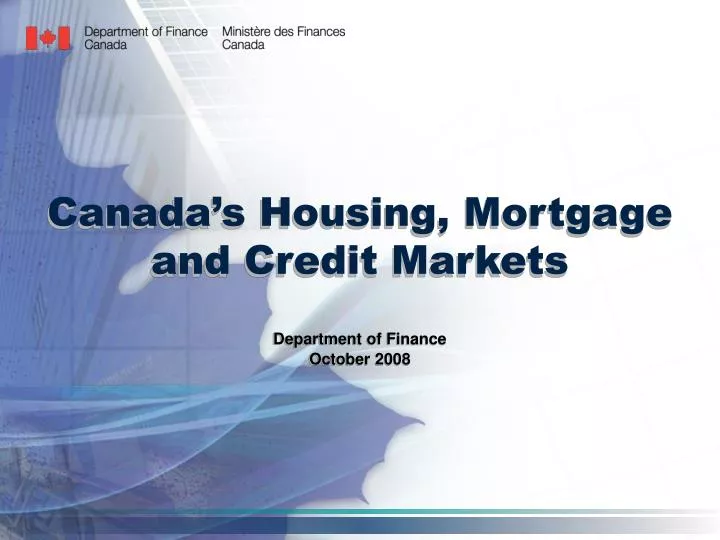
Canada’s Housing, Mortgage and Credit Markets. Department of Finance October 2008. Strong housing price growth in Canada followed a prolonged period of weakness leading to much lower levels than in the U.S. by the mid 2000s. Existing Home Prices. Index = 100 in 1989Q1. 280. 260.

E N D
Canada’s Housing, Mortgage and Credit Markets • Department of Finance • October 2008
Strong housing price growth in Canada followed a prolonged period of weakness leading to much lower levels than in the U.S. by the mid 2000s. Existing Home Prices Index = 100 in 1989Q1 280 260 U.S. S&P/Case-Shiller home price index 240 220 200 180 Canada 160 140 120 100 80 89Q1 91Q1 93Q1 95Q1 97Q1 99Q1 01Q1 03Q1 05Q1 07Q1 Source: Canadian Real Estate Association; S&P, Fiserv, and MacroMarkets LLC.
According to the IMF, house price growth in Canada has been fully explained by fundamental factors. IMF: Divergence from price growth suggested by fundamentals (1997-2007) Per cent 40 30 20 10 0 -10 U.S. Italy U.K. Spain Korea Japan Ireland France Greece Austria Finland Norway Canada Sweden Zealand Belgium New Portugal Denmark Australia Germany Netherlands Source: IMF Fall 2008 World Economic Outlook. The IMF definition of fundamental factors includes: disposable income growth per capita, short- and long-term interest rates, credit growth, equity price growth and growth in the working population. Price growth that is not explained by these factors can be interpreted as a measure of over valuation and, therefore, the susceptibility of a correction in house prices.
Mortgage debt relative to the value of housing has declined in Canada since 2001 - unlike the U.S. Ratio of Mortgages to the Value of Housing Ratio 0.6 2008Q2: 0.55 U.S. 0.55 0.5 0.45 0.4 Canada 0.35 2008Q2: 0.31 0.3 0.25 2001Q1 2003Q1 2005Q1 2007Q1 Source: Statistics Canada; U.S. Federal Reserve
The share of mortgages in arrears in Canada remains low, suggesting that Canadian households are better able to service their mortgages. Percent of Mortgages in 90-day Arrears Per cent 5 08Q2: 4.5% U.S. 4 3 2 1 Canada 08Q2: 0.3% 0 2002Q1 2004Q1 2006Q1 2008Q1 Source: Canadian Bankers’ Association; Bloomberg
Average Tier 1 Capital Ratios of Major Banks 11.00 AVG CDN Banks 10.00 AVG U.S. AVG U.K. AVG Euro 9.00 Banks Banks Banks 8.00 Tier 1 Capital Ratio 7.00 6.00 5.00 4.00 3.00
Canadian Interest Rate Spreads Banks' Cost of Funds vs. Government of Canada basis points 350 325 Short term (3-month Bankers' Acceptance vs. T-Bill) 300 Medium term (Merrill Lynch Canadian Financial Index vs. GOC 5-year) 275 250 225 200 175 150 125 100 75 50 25 0 Oct-00 May-01 Dec-01 Jul-02 Mar-03 Oct-03 May-04 Dec-04 Aug-05 Mar-06 Oct-06 May-07 Dec-07 Aug-08 Source: Bloomberg