Download
1 / 1
10 likes | 107 Views
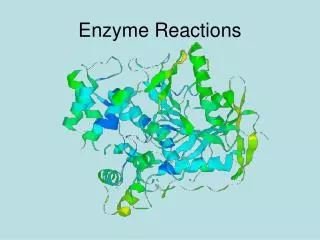
The Difference Between Enzyme Reactions due to Varying pH Zane Rusk, Alexis Stroud, Quentin Romero, Aileen Sotelo Amarillo College and Randall High School. Key - Trial 1 - Trial 2 - Average rate of change Original function- positive curve

E N D
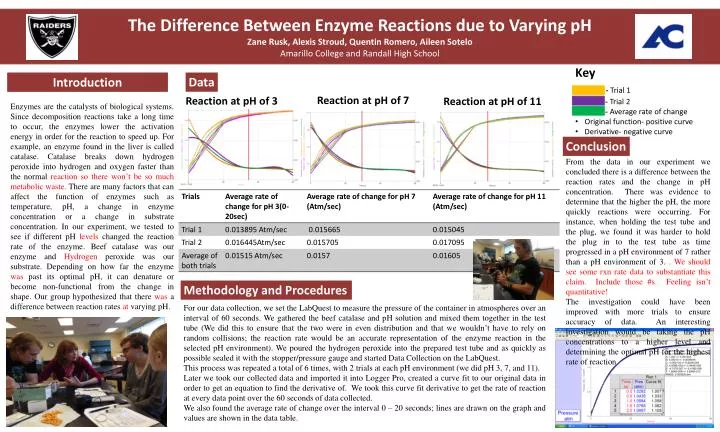
The Difference Between Enzyme Reactions due to Varying pH Zane Rusk, Alexis Stroud, Quentin Romero, Aileen Sotelo Amarillo College and Randall High School • Key • - Trial 1 • - Trial 2 • - Average rate of change • Original function- positive curve • Derivative- negative curve Data Introduction Reaction at pH of 7 Reaction at pH of 3 Reaction at pH of 11 Enzymes are the catalysts of biological systems. Since decomposition reactions take a long time to occur, the enzymes lower the activation energy in order for the reaction to speed up. For example, an enzyme found in the liver is called catalase. Catalase breaks down hydrogen peroxide into hydrogen and oxygen faster than the normal reaction so there won’t be so much metabolic waste. There are many factors that can affect the function of enzymes such as temperature, pH, a change in enzyme concentration or a change in substrate concentration. In our experiment, we tested to see if different pH levelschanged the reaction rate of the enzyme. Beef catalase was our enzyme and Hydrogen peroxide was our substrate. Depending on how far the enzyme was past its optimal pH, it can denature or become non-functional from the change in shape. Our group hypothesized that there was a difference between reaction rates at varying pH. Conclusion From the data in our experiment we concluded there is a difference between the reaction rates and the change in pH concentration. There was evidence to determine that the higher the pH, the more quickly reactions were occurring. For instance, when holding the test tube and the plug, we found it was harder to hold the plug in to the test tube as time progressed in a pH environment of 7 rather than a pH environment of 3. . We should see some rxn rate data to substantiate this claim. Include those #s. Feeling isn’t quantitative! The investigation could have been improved with more trials to ensure accuracy of data. An interesting investigation would be taking the pH concentrations to a higher level and determining the optimal pH for the highest rate of reaction Methodology and Procedures For our data collection, we set the LabQuest to measure the pressure of the container in atmospheres over an interval of 60 seconds. We gathered the beef catalase and pH solution and mixed them together in the test tube (We did this to ensure that the two were in even distribution and that we wouldn’t have to rely on random collisions; the reaction rate would be an accurate representation of the enzyme reaction in the selected pH environment). We poured the hydrogen peroxide into the prepared test tube and as quickly as possible sealed it with the stopper/pressure gauge and started Data Collection on the LabQuest. This process was repeated a total of 6 times, with 2 trials at each pH environment (we did pH 3, 7, and 11). Later we took our collected data and imported it into Logger Pro, created a curve fit to our original data in order to get an equation to find the derivative of. We took this curve fit derivative to get the rate of reaction at every data point over the 60 seconds of data collected. We also found the average rate of change over the interval 0 – 20 seconds; lines are drawn on the graph and values are shown in the data table.