Download

1 / 36
360 likes | 630 Views
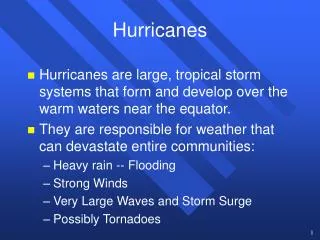
Rapid Intensification of Hurricanes. By: Andrew Lee. Kaplan and Demaria 2003 Paper. Findings of Previous Studies. Ocean’s impact on tropical cyclone (TC) intensity: Upwelling and vertical mixing of the cool ocean due to the vortex can have a negative feedback

E N D
Rapid Intensification of Hurricanes By: Andrew Lee
Findings of Previous Studies • Ocean’s impact on tropical cyclone (TC) intensity: • Upwelling and vertical mixing of the cool ocean due to the vortex can have a negative feedback • On the other hand,eddies can contribute to rapid intensification (RI) • Inner core processes: concentric eyewall cycles • Collapse of inner eyewall results in weakening • Contraction of outer eyewall can strengthen a TC • Vertical Shear • Low vertical shear results in RI
Findings of Previous Studies Continued • Interaction of a TC with an upper-level trough • Studies are conflicting on this matter • Other important factors • Deep layer of warm water • Time of Day • Eye diameter • And many others
Goal of the Study • Determine if RI mechanisms proposed in previous studies can be confirmed for a large dataset • Compare characteristics of RI and non-RI storms • Develop a method for estimating the probability of RI • Serves as a rapid intensity index (RII)
Rapid Intensification (RI) definition) • 95th percentile of over-water 24-hour intensity changes of Atlantic basin tropical cyclones that developed from 1989 to 2000 • Maximum sustained surface wind speed increase of 15.4 m/s (30 kt) over a 24-h period.
Data • Statistical Hurricane Intensity Prediction Scheme (SHIPS) database • Contains synoptic information every 12 hours • the NHC Hurricane Database (HURDAT) file used to analyze data • 6-hour estimates of various variables • All Atlantic basin TCs from 1989 to 2000 • Variables measured starting at t=0 hours • Non-developing depression information in NHC B Decks • If TC is over land for ≤1 hour, it is an over-water system. • 163 TCs (tropical depressions, tropical storms, and hurricanes) for a total of 2621 cases.
Maximum Potential Intensity(MPI) • MPI = min[X, 85] • X = A + B(exp)[C(SST-SST0)] • A = 34.2 m/s • B = 55.8 m/s • C=0.1813 0C-1 • SST0 = 300C
Frequency Distribution • Tropical storms had more changes exceeding 3 m/s than hurricanes or tropical depressions • Tropical storms are further from their MPI and are better organized initially, so they can intensify faster.
Distribution of Intensity Change • Sample size: 50 TCs, 159 RI cases • 4.4%, 7.4%, and 5.4% of the tropical depression, tropical storm, and hurricane samples underwent RI, respectively.
Systems that featured RI • 60% of systems were hurricane strength • 83% reached major hurricane intensity • All category 4 and 5 hurricanes underwent RI at least once • 31% of all Atlantic TCs and 38% of all named storms underwent RI
Seasonality and Location of RI • RI occurs mostly south of 300N • Fewer RI cases in eastern Caribbean and eastern Gulf of Mexico. • Most RI during August and September.
Large-Scale Conditions • Statistical significance determined by 2-sided t test that assumes unequal variances • * = 95%, **=99%, ***=99.9% • RI systems tend to be located farther south and west than Non-RI systems • RI systems have a more westerly component of motion
Large-Scale Conditions Continued • RI systems have high SST, RHLO, and POT • No statistical significance between VMX, JDAY, and SPD for RI and non-RI • Most statistically significant differences for SST, RHLO, POT, SHR, and U200. • RI have low SHR and REFC, situated in a 200-hPa flow • Impact of troughs on TC depends on environment • RI cases have low VMX • RI occurs most frequently from 10 to 15 degrees N, and generally decreases with increasing LAT • RI tend to commence east of 400W and from 800to 1000W • Slow storm speed negatively impacts TC intensity. • 92% of RI cases have SSTs about 270C • RI cases have high POT, RHLO and relative humidity • RI cases have low SHR and REFC
Estimating Probability of RI • Only done for statistical significance of 95% or greater • RI threshold = RI sample mean • RI probability = number of RI cases satisfying RI threshold / number of cases in entire sample that satisfy the threshold. • Various sets of predictors combined into 5 predictors (at 99.9% statistically significant): DVMX, SHR, SST, POT, and RHLO • The resulting data on next slide:
Key Findings from Study • Definition of RI proposed for Atlantic TCs • The RI cases tended to occur farther south and west than the non-RI cases. • The RI cases were farther from their maximum potential intensity and developed in regions of warmer water and higher lower-troposphericrelative humidity than the non-RI cases. • Probability of RI prediction involved 5 factors: previous 12-h intensity change, sea surface temperature, low-level relative humidity, vertical shear, and the difference between the current intensity and the maximum potential TC intensity
Future Work • Add additional predictors: • Upper-ocean heat content • Geostationary Operational Environmental Satellite (GOES) infrared satellite imagery • Use More sophisticated statistical methods
Goals • Develop a revised rapid intensity index (RII) • Both for Atlantic and eastern North Pacific basin • Create versions of RII for 2 other RI thresholds: 25 and 35 kt (Kaplan 2003’s was 30 kt) • Verify the revised RII using basin samples for all 3 thresholds
Methodology • Mostly same procedures and data as in the Kaplan 2003 paper. • Subtropical cases are included. • 4 new predictors added:
Methodology Differences from 2003 • SHRD is evaluated after the storm vortex is removed • POT is determined using an adjusted inner-core SST computed using an algorithm derived exclusively for the Atlantic basin. • Large-scale predictors are averaged along the storm track from t=0 to t=24 h as opposed to being evaluated at t=0 hours • Cases used for the study had to pass through screening first: • POT must be as large as the RI threshold
Methodology Differences Continued • Cases where the values of any of the 8 predictors are outside the range of RI predictor magnitudes of the RI cases in the development sample aren’t used
RI distribution • Tracks for 35-kt are more restricted • Few North of 300N • Concentrated in central Atlantic between 100N and 200N and 200 and 600W
RI Predictor Data • RI systems have high PER, OHC, D200, RHLO, PX30, and SDBT • RI systems have low SHRD and SDB
Scaled Version of RII • Kaplan 2003 paper couldn’t account for the degree to which conditions were favorable or unfavorable. • Each predictor is assigned a scaled value between 0 (least conductive) and 1 (most conductive) for RI (Sp) • Sum all the scaled values (RS) • RS= 0 if any of the Sp = 0 • Place RS values into 4 quartiles • Lowest RS in the first quartile • Equal number of RI cases in each quartile • Probability is calculated by dividing number of RI cases by total number of cases in each quartile.
Linear Discriminant version of RI • Accounts for relative importance of each predictor • RS = 0 samples excluded • Each weight, Wn, is multiplied by the corresponding Sp, then add everything (Rd) • The Rd’s are put into quartiles and the probabilities calculated in the same way as the scaled version
RI Predictor Weight Results • Kinematic predictors (D200 and SHRD) have at least twice the weight of thermodynamic predictors (POT, RHLO, and OHC) for all thresholds • Predictors can be treated as independent of each other
RII Skill Calculation • First, compute the Brier Score (BS) • Convert Rs and Rd values to RI probabilities (0 to 1) by linearly interpolating • Subtract from 0 if RI is not observed • Subtract from 1 when RI is observed • Square that number • Compute the Brier Skill Score (BSS): • BSS = [1-(BSM/BSC)] x 100 • BSM= BS of RII forecast • BSC= BS of climatological forecast • 100%= prefect skill
Probabilistic Verification • Cross validation method • Storms from each of the individual years that composed the 12-year developmental sample are excluded • RII is rederived for each RI threshold using only cases from the remaining 11-year sample • That RII is run on the cases from the excluded year • Repeat the procedure for each of the individual years in the 12 year sample and tabulate results
Deterministic Verification • Choose a single probability threshold • The value of the discriminant function that matches the climatological probability of false detection (POFD) • POFD = climatological probability of RI/ (1 + climatological probability of RI for each RI threshold) • Repeat the calculation of POFD for each quartile and each threshold
Conclusions • Revised RII index made for Atlantic and North Pacific Basins • Separate RII index made for 25kt and 35 kt • Probability of detection (POD) for the RII ranged from 15% to 59% (53% to 73%) while the false alarm ratio (FAR) ranged from 71% to 85% (53% to 79%) in the Atlantic (eastern North Pacific) basins, respectively. So, generally pretty good.